| Param | Original file | Final file |
|---|---|---|
| Filename | modeM0/AS1P01_015T01_9000000074cztM0_level2_bc.evt | modeM0/AS1P01_015T01_9000000074cztM0_level2_quad_clean.evt |
| Size (bytes) | 808,430,400 | 185,682,240 |
| Size | 771.0 MB | 177.1 MB |
| Events in quadrant A | 5,167,584 | 1,004,023 |
| Events in quadrant B | 4,990,247 | 1,018,158 |
| Events in quadrant C | 4,664,790 | 1,003,038 |
| Events in quadrant D | 8,043,712 | 970,022 |
| Mode M9 | |||
|---|---|---|---|
| Quadrant | BADHDUFLAG | Total packets | Discarded packets |
| A | 0 | 128 | 0 |
| B | 0 | 128 | 0 |
| C | 0 | 128 | 0 |
| D | 0 | 128 | 0 |
| Mode M0 | |||
|---|---|---|---|
| Quadrant | BADHDUFLAG | Total packets | Discarded packets |
| A | 0 | 104264 | 0 |
| B | 0 | 102163 | 0 |
| C | 0 | 97023 | 0 |
| D | 0 | 104694 | 0 |
| Mode SS | |||
|---|---|---|---|
| Quadrant | BADHDUFLAG | Total packets | Discarded packets |
| A | 0 | 484 | 0 |
| B | 0 | 484 | 0 |
| C | 0 | 484 | 0 |
| D | 0 | 484 | 0 |
| Quadrant | Total seconds | Saturated seconds | Saturation percentage |
|---|---|---|---|
| A | 23658 | 46 | 0.194437% |
| B | 23658 | 83 | 0.350833% |
| C | 23658 | 83 | 0.350833% |
| D | 23658 | 249 | 1.052498% |
Noise dominated data is calculated using 1-second bins in cleaned event files. If a bin has >2000 counts, and if more than 50% of those come from <1% of pixels, then it is considered to be noise-dominated and hence unusable.
| Quadrant | # 1 sec bins | Bins with >0 counts | Bins with >2000 counts | High rate bins dominated by noise | Noise dominated (total time) | Noise dominated (detector-on time) | Marked lightcurve |
|---|---|---|---|---|---|---|---|
| A | 34432 | 23658 | 9 | 9 | 0.03% | 0.04% |  |
| B | 34432 | 23658 | 27 | 27 | 0.08% | 0.11% |  |
| C | 34432 | 23658 | 11 | 11 | 0.03% | 0.05% |  |
| D | 34432 | 23658 | 42 | 42 | 0.12% | 0.18% |  |
Top three noisy pixels from each quadrant. If the there are fewer than three noisy pixels in the level2.evt file, extra rows are filled as -1
| Pixel properties | Quadrant properties | ||||||
|---|---|---|---|---|---|---|---|
| Quadrant | DetID | PixID | Counts | Sigma | Mean | Median | Sigma |
| A | 0 | 238 | 500005 | 2300.6 | 1035 | 1011 | 216.9 |
| A | 13 | 160 | 190455 | 873.43 | 1035 | 1011 | 216.9 |
| A | 0 | 69 | 120052 | 548.84 | 1035 | 1011 | 216.9 |
| B | 5 | 2 | 191376 | 1012.8 | 1061 | 1025 | 187.9 |
| B | 8 | 4 | 100353 | 528.49 | 1061 | 1025 | 187.9 |
| B | 0 | 230 | 96363 | 507.26 | 1061 | 1025 | 187.9 |
| C | 3 | 159 | 381344 | 1783.97 | 1021 | 1000 | 213.2 |
| C | 15 | 241 | 49848 | 229.12 | 1021 | 1000 | 213.2 |
| C | 9 | 206 | 46159 | 211.81 | 1021 | 1000 | 213.2 |
| D | 1 | 4 | 1402137 | 6308.66 | 1009 | 978 | 222.1 |
| D | 13 | 221 | 593985 | 2669.99 | 1009 | 978 | 222.1 |
| D | 12 | 237 | 458894 | 2061.75 | 1009 | 978 | 222.1 |
Histogram calculated using DETX and DETY for each event in the final _common_clean file
| Quadrant A |  |
 |
Quadrant B |
|---|---|---|---|
| Quadrant D |  |
 |
Quadrant C |
| Plot type | Count rate plots | Images |
|---|---|---|
| Comparison with Poisson distribution Blue bars denote a histogram of data divided into 1 sec bins. Red curve is a Poisson curve with rate = median count rate of data. |
 |
 |
| Quadrant-wise count rates Data is divided into 100 sec bins |
 |
|
| Module-wise count rates for Quadrant A Data is divided into 100 sec bins |
 |
 |
| Module-wise count rates for Quadrant B Data is divided into 100 sec bins |
 |
 |
| Module-wise count rates for Quadrant C Data is divided into 100 sec bins |
 |
 |
| Module-wise count rates for Quadrant D Data is divided into 100 sec bins |
 |
 |
| Parameter | Plot |
|---|---|
| CZT HV Monitor | 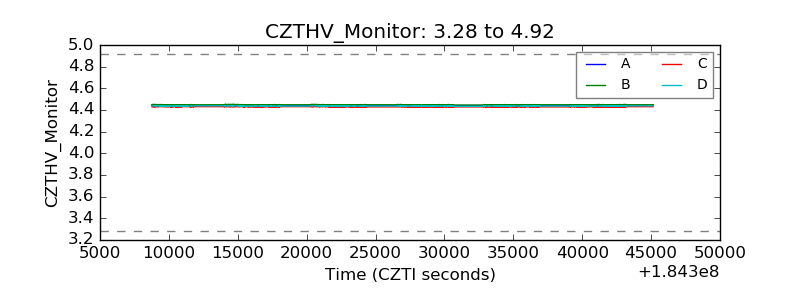 |
| D_VDD |  |
| Temperature 1 |  |
| Veto HV Monitor |  |
| Veto LLD |  |
| Alpha Counter |  |
| _CPM_Rate |  |
| CZT Counter |  |
| +2.5 Volts monitor | 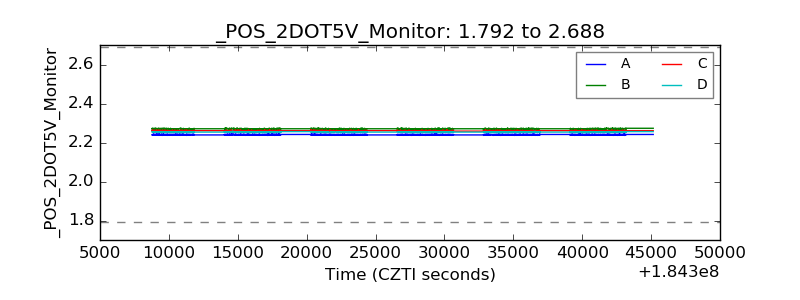 |
| +5 Volts monitor |  |
| _ROLL_ROT | 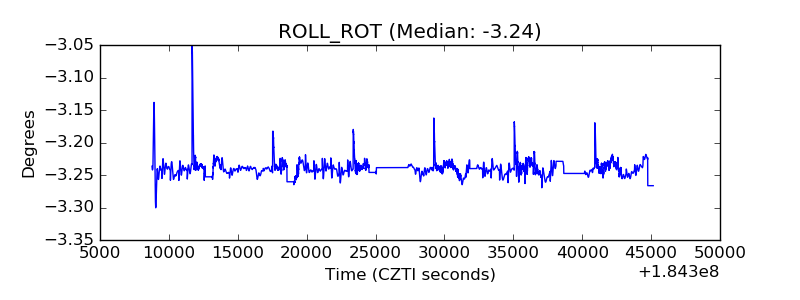 |
| _Roll_DEC |  |
| _Roll_RA |  |
| Veto Counter |  |