| Param | Original file | Final file |
|---|---|---|
| Filename | modeM0/AS1P01_044T01_9000000072cztM0_level2_bc.evt | modeM0/AS1P01_044T01_9000000072cztM0_level2_quad_clean.evt |
| Size (bytes) | 16,342,421,760 | 4,628,197,440 |
| Size | 15.2 GB | 4.3 GB |
| Events in quadrant A | 118,162,935 | 27,368,472 |
| Events in quadrant B | 98,887,878 | 27,807,285 |
| Events in quadrant C | 105,309,968 | 27,365,425 |
| Events in quadrant D | 141,583,670 | 26,446,140 |
| Mode M0 | |||
|---|---|---|---|
| Quadrant | BADHDUFLAG | Total packets | Discarded packets |
| A | 0 | 2039472 | 0 |
| B | 0 | 1963008 | 0 |
| C | 0 | 1888445 | 0 |
| D | 0 | 1906799 | 0 |
| Mode SS | |||
|---|---|---|---|
| Quadrant | BADHDUFLAG | Total packets | Discarded packets |
| A | 0 | 9380 | 0 |
| B | 0 | 9315 | 0 |
| C | 0 | 9336 | 0 |
| D | 0 | 9264 | 0 |
| Mode M9 | |||
|---|---|---|---|
| Quadrant | BADHDUFLAG | Total packets | Discarded packets |
| A | 0 | 2442 | 0 |
| B | 0 | 2425 | 0 |
| C | 0 | 2443 | 0 |
| D | 0 | 2435 | 0 |
| Quadrant | Total seconds | Saturated seconds | Saturation percentage |
|---|---|---|---|
| A | 455330 | 6430 | 1.412163% |
| B | 455600 | 3157 | 0.692932% |
| C | 455657 | 6726 | 1.476110% |
| D | 455637 | 5418 | 1.189104% |
Noise dominated data is calculated using 1-second bins in cleaned event files. If a bin has >2000 counts, and if more than 50% of those come from <1% of pixels, then it is considered to be noise-dominated and hence unusable.
| Quadrant | # 1 sec bins | Bins with >0 counts | Bins with >2000 counts | High rate bins dominated by noise | Noise dominated (total time) | Noise dominated (detector-on time) | Marked lightcurve |
|---|---|---|---|---|---|---|---|
| A | 775535 | 455872 | 2773 | 2773 | 0.36% | 0.61% |  |
| B | 775535 | 456094 | 305 | 305 | 0.04% | 0.07% |  |
| C | 775535 | 456180 | 646 | 646 | 0.08% | 0.14% |  |
| D | 775535 | 456161 | 2088 | 2088 | 0.27% | 0.46% | 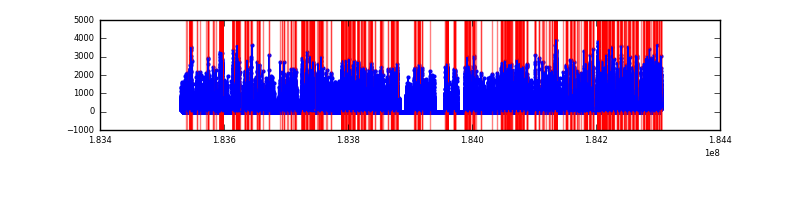 |
Top three noisy pixels from each quadrant. If the there are fewer than three noisy pixels in the level2.evt file, extra rows are filled as -1
| Pixel properties | Quadrant properties | ||||||
|---|---|---|---|---|---|---|---|
| Quadrant | DetID | PixID | Counts | Sigma | Mean | Median | Sigma |
| A | 11 | 191 | 11588368 | 2855.09 | 19724 | 19312 | 4052.1 |
| A | 0 | 238 | 10715489 | 2639.67 | 19724 | 19312 | 4052.1 |
| A | 15 | 171 | 4344356 | 1067.36 | 19724 | 19312 | 4052.1 |
| B | 2 | 32 | 3242433 | 910.03 | 20315 | 19697 | 3541.4 |
| B | 5 | 176 | 1917677 | 535.95 | 20315 | 19697 | 3541.4 |
| B | 5 | 249 | 1667800 | 465.39 | 20315 | 19697 | 3541.4 |
| C | 3 | 159 | 14948431 | 3717.38 | 19459 | 19115 | 4016.1 |
| C | 5 | 249 | 4052017 | 1004.19 | 19459 | 19115 | 4016.1 |
| C | 15 | 241 | 2293791 | 566.39 | 19459 | 19115 | 4016.1 |
| D | 1 | 4 | 8418591 | 1945.06 | 19415 | 18849 | 4318.5 |
| D | 12 | 237 | 7042737 | 1626.46 | 19415 | 18849 | 4318.5 |
| D | 1 | 5 | 4559473 | 1051.43 | 19415 | 18849 | 4318.5 |
Histogram calculated using DETX and DETY for each event in the final _common_clean file
| Quadrant A |  |
 |
Quadrant B |
|---|---|---|---|
| Quadrant D |  |
 |
Quadrant C |
| Plot type | Count rate plots | Images |
|---|---|---|
| Comparison with Poisson distribution Blue bars denote a histogram of data divided into 1 sec bins. Red curve is a Poisson curve with rate = median count rate of data. |
 |
 |
| Quadrant-wise count rates Data is divided into 100 sec bins |
 |
|
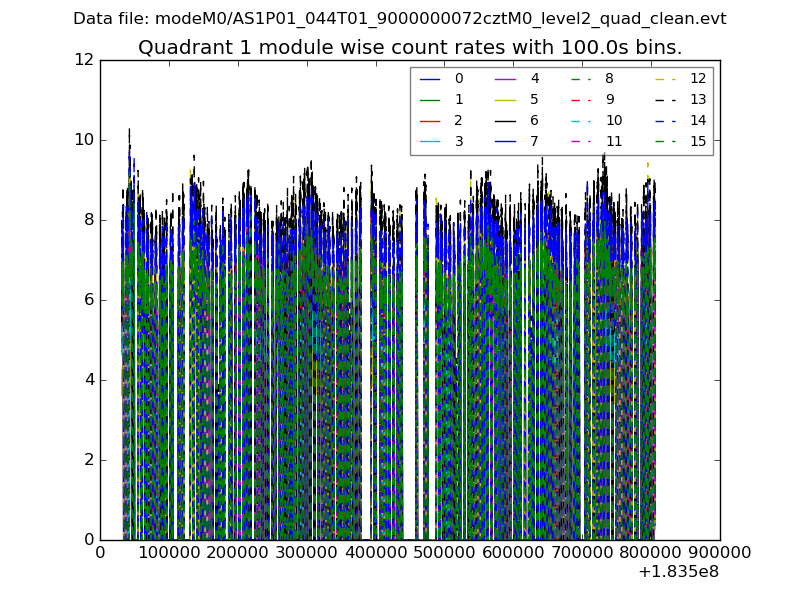
| Module-wise count rates for Quadrant A Data is divided into 100 sec bins |
 |
 |
| Module-wise count rates for Quadrant B Data is divided into 100 sec bins |
 |
 |
| Module-wise count rates for Quadrant C Data is divided into 100 sec bins |
 |
 |
| Module-wise count rates for Quadrant D Data is divided into 100 sec bins |
 |
 |
| Parameter | Plot |
|---|---|
| CZT HV Monitor |  |
| D_VDD |  |
| Temperature 1 |  |
| Veto HV Monitor |  |
| Veto LLD |  |
| Alpha Counter |  |
| _CPM_Rate |  |
| CZT Counter |  |
| +2.5 Volts monitor |  |
| +5 Volts monitor |  |
| Veto Counter |  |