| Param | Original file | Final file |
|---|---|---|
| Filename | modeM0/AS1P01_161T01_9000000068cztM0_level2_bc.evt | modeM0/AS1P01_161T01_9000000068cztM0_level2_quad_clean.evt |
| Size (bytes) | 1,249,796,160 | 232,911,360 |
| Size | 1.2 GB | 222.1 MB |
| Events in quadrant A | 6,396,884 | 1,288,624 |
| Events in quadrant B | 7,734,997 | 1,301,542 |
| Events in quadrant C | 10,901,529 | 1,271,573 |
| Events in quadrant D | 10,864,455 | 1,222,527 |
| Mode SS | |||
|---|---|---|---|
| Quadrant | BADHDUFLAG | Total packets | Discarded packets |
| A | 0 | 586 | 0 |
| B | 0 | 586 | 0 |
| C | 0 | 586 | 0 |
| D | 0 | 586 | 0 |
| Mode M9 | |||
|---|---|---|---|
| Quadrant | BADHDUFLAG | Total packets | Discarded packets |
| A | 0 | 136 | 0 |
| B | 0 | 136 | 0 |
| C | 0 | 136 | 0 |
| D | 0 | 136 | 0 |
| Mode M0 | |||
|---|---|---|---|
| Quadrant | BADHDUFLAG | Total packets | Discarded packets |
| A | 0 | 127025 | 0 |
| B | 0 | 129409 | 0 |
| C | 0 | 132298 | 0 |
| D | 0 | 132196 | 0 |
| Quadrant | Total seconds | Saturated seconds | Saturation percentage |
|---|---|---|---|
| A | 28642 | 30 | 0.104741% |
| B | 28642 | 279 | 0.974094% |
| C | 28642 | 492 | 1.717757% |
| D | 28642 | 765 | 2.670903% |
Noise dominated data is calculated using 1-second bins in cleaned event files. If a bin has >2000 counts, and if more than 50% of those come from <1% of pixels, then it is considered to be noise-dominated and hence unusable.
| Quadrant | # 1 sec bins | Bins with >0 counts | Bins with >2000 counts | High rate bins dominated by noise | Noise dominated (total time) | Noise dominated (detector-on time) | Marked lightcurve |
|---|---|---|---|---|---|---|---|
| A | 41032 | 28643 | 1 | 1 | 0.00% | 0.00% |  |
| B | 41032 | 28642 | 89 | 89 | 0.22% | 0.31% | 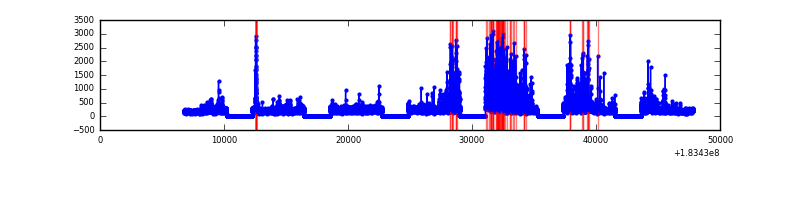 |
| C | 41032 | 28642 | 402 | 402 | 0.98% | 1.40% |  |
| D | 41032 | 28643 | 57 | 57 | 0.14% | 0.20% | 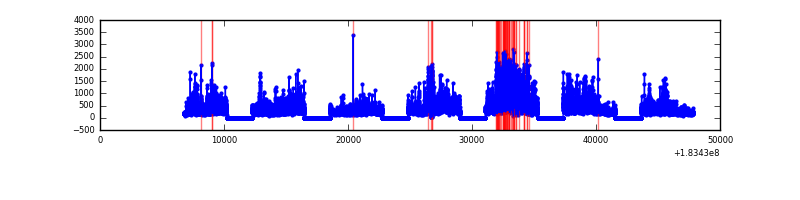 |
Top three noisy pixels from each quadrant. If the there are fewer than three noisy pixels in the level2.evt file, extra rows are filled as -1
| Pixel properties | Quadrant properties | ||||||
|---|---|---|---|---|---|---|---|
| Quadrant | DetID | PixID | Counts | Sigma | Mean | Median | Sigma |
| A | 0 | 238 | 525673 | 1906.05 | 1342 | 1321 | 275.1 |
| A | 15 | 85 | 142298 | 512.46 | 1342 | 1321 | 275.1 |
| A | 15 | 200 | 107984 | 387.73 | 1342 | 1321 | 275.1 |
| B | 2 | 32 | 1439319 | 6049.52 | 1363 | 1331 | 237.7 |
| B | 0 | 220 | 209352 | 875.13 | 1363 | 1331 | 237.7 |
| B | 5 | 46 | 99665 | 413.68 | 1363 | 1331 | 237.7 |
| C | 1 | 1 | 3691040 | 13563.19 | 1306 | 1291 | 272.0 |
| C | 2 | 53 | 1412146 | 5186.18 | 1306 | 1291 | 272.0 |
| C | 3 | 159 | 355448 | 1301.85 | 1306 | 1291 | 272.0 |
| D | 13 | 7 | 1579905 | 5557.55 | 1291 | 1263 | 284.1 |
| D | 13 | 221 | 834606 | 2933.75 | 1291 | 1263 | 284.1 |
| D | 1 | 4 | 658019 | 2312.08 | 1291 | 1263 | 284.1 |
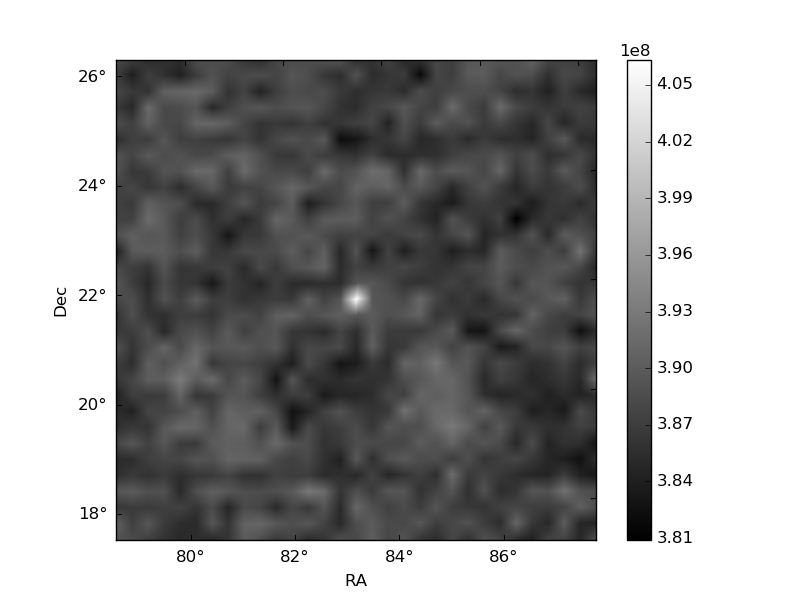
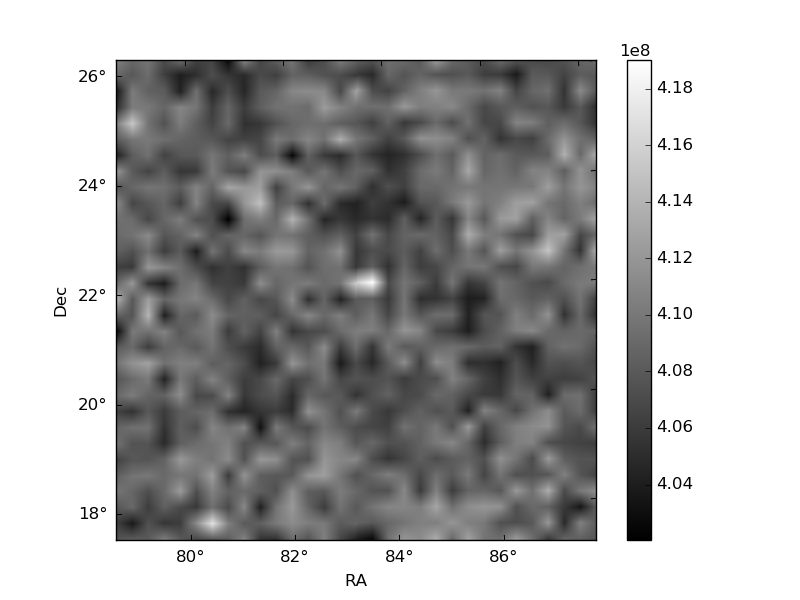
Histogram calculated using DETX and DETY for each event in the final _common_clean file
| Quadrant A | 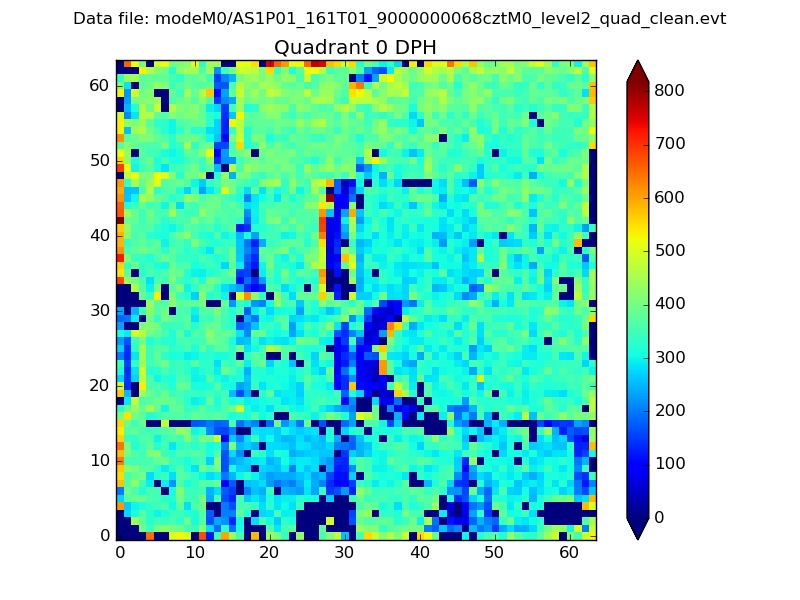 |
 |
Quadrant B |
|---|---|---|---|
| Quadrant D | 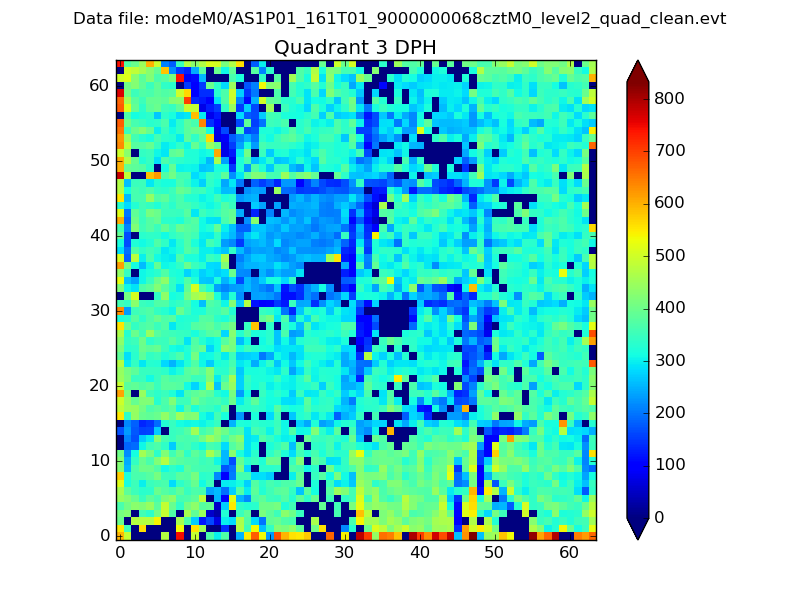 |
 |
Quadrant C |
| Plot type | Count rate plots | Images |
|---|---|---|
| Comparison with Poisson distribution Blue bars denote a histogram of data divided into 1 sec bins. Red curve is a Poisson curve with rate = median count rate of data. |
 |
 |
| Quadrant-wise count rates Data is divided into 100 sec bins |
 |
|
| Module-wise count rates for Quadrant A Data is divided into 100 sec bins |
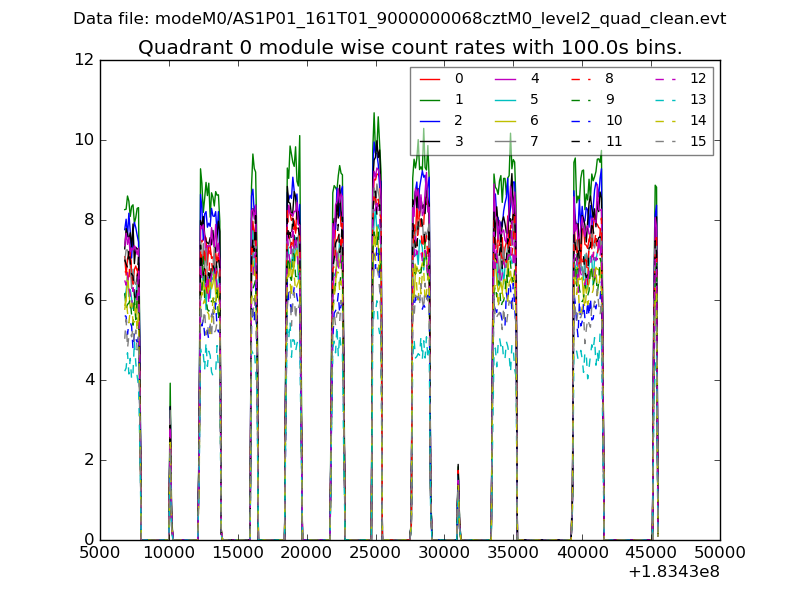 |
 |
| Module-wise count rates for Quadrant B Data is divided into 100 sec bins |
 |
 |
| Module-wise count rates for Quadrant C Data is divided into 100 sec bins |
 |
 |
| Module-wise count rates for Quadrant D Data is divided into 100 sec bins |
 |
 |
| Parameter | Plot |
|---|---|
| CZT HV Monitor |  |
| D_VDD | 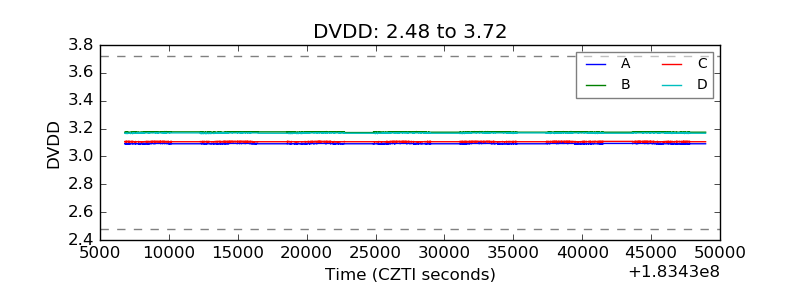 |
| Temperature 1 |  |
| Veto HV Monitor |  |
| Veto LLD |  |
| Alpha Counter |  |
| _CPM_Rate |  |
| CZT Counter |  |
| +2.5 Volts monitor |  |
| +5 Volts monitor |  |
| _ROLL_ROT |  |
| _Roll_DEC |  |
| _Roll_RA |  |
| Veto Counter |  |