| Param | Original file | Final file |
|---|---|---|
| Filename | modeM0/AS1P01_888T88_9000000064cztM0_level2_bc.evt | modeM0/AS1P01_888T88_9000000064cztM0_level2_quad_clean.evt |
| Size (bytes) | 660,798,720 | 250,323,840 |
| Size | 630.2 MB | 238.7 MB |
| Events in quadrant A | 3,841,533 | 1,642,862 |
| Events in quadrant B | 3,719,662 | 1,648,808 |
| Events in quadrant C | 3,326,818 | 1,631,974 |
| Events in quadrant D | 7,998,414 | 1,524,449 |
| Mode M0 | |||
|---|---|---|---|
| Quadrant | BADHDUFLAG | Total packets | Discarded packets |
| A | 0 | 71387 | 0 |
| B | 0 | 70192 | 0 |
| C | 0 | 66255 | 0 |
| D | 0 | 84320 | 0 |
| Mode M9 | |||
|---|---|---|---|
| Quadrant | BADHDUFLAG | Total packets | Discarded packets |
| A | 0 | 83 | 0 |
| B | 0 | 83 | 0 |
| C | 0 | 83 | 0 |
| D | 0 | 83 | 0 |
| Mode SS | |||
|---|---|---|---|
| Quadrant | BADHDUFLAG | Total packets | Discarded packets |
| A | 0 | 336 | 0 |
| B | 0 | 336 | 0 |
| C | 0 | 336 | 0 |
| D | 0 | 336 | 0 |
| Quadrant | Total seconds | Saturated seconds | Saturation percentage |
|---|---|---|---|
| A | 16443 | 36 | 0.218938% |
| B | 16443 | 34 | 0.206775% |
| C | 16443 | 38 | 0.231101% |
| D | 16443 | 1280 | 7.784468% |
Noise dominated data is calculated using 1-second bins in cleaned event files. If a bin has >2000 counts, and if more than 50% of those come from <1% of pixels, then it is considered to be noise-dominated and hence unusable.
| Quadrant | # 1 sec bins | Bins with >0 counts | Bins with >2000 counts | High rate bins dominated by noise | Noise dominated (total time) | Noise dominated (detector-on time) | Marked lightcurve |
|---|---|---|---|---|---|---|---|
| A | 24704 | 16444 | 13 | 13 | 0.05% | 0.08% |  |
| B | 24704 | 16443 | 4 | 4 | 0.02% | 0.02% |  |
| C | 24704 | 16444 | 18 | 18 | 0.07% | 0.11% | 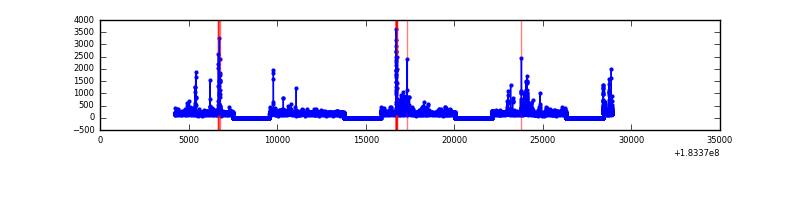 |
| D | 24704 | 16435 | 80 | 80 | 0.32% | 0.49% |  |
Top three noisy pixels from each quadrant. If the there are fewer than three noisy pixels in the level2.evt file, extra rows are filled as -1
| Pixel properties | Quadrant properties | ||||||
|---|---|---|---|---|---|---|---|
| Quadrant | DetID | PixID | Counts | Sigma | Mean | Median | Sigma |
| A | 0 | 238 | 501981 | 3198.78 | 749 | 737 | 156.7 |
| A | 8 | 192 | 105657 | 669.57 | 749 | 737 | 156.7 |
| A | 15 | 200 | 71288 | 450.23 | 749 | 737 | 156.7 |
| B | 4 | 82 | 180899 | 1341.04 | 761 | 741 | 134.3 |
| B | 0 | 182 | 82455 | 608.25 | 761 | 741 | 134.3 |
| B | 0 | 153 | 57873 | 425.27 | 761 | 741 | 134.3 |
| C | 3 | 159 | 219117 | 1389.75 | 737 | 728 | 157.1 |
| C | 2 | 53 | 73200 | 461.19 | 737 | 728 | 157.1 |
| C | 5 | 234 | 62439 | 392.71 | 737 | 728 | 157.1 |
| D | 13 | 7 | 3709040 | 23294.16 | 708 | 691 | 159.2 |
| D | 1 | 5 | 253915 | 1590.64 | 708 | 691 | 159.2 |
| D | 13 | 51 | 225997 | 1415.27 | 708 | 691 | 159.2 |
Histogram calculated using DETX and DETY for each event in the final _common_clean file
| Quadrant A |  |
 |
Quadrant B |
|---|---|---|---|
| Quadrant D |  |
 |
Quadrant C |
| Plot type | Count rate plots | Images |
|---|---|---|
| Comparison with Poisson distribution Blue bars denote a histogram of data divided into 1 sec bins. Red curve is a Poisson curve with rate = median count rate of data. |
 |
 |
| Quadrant-wise count rates Data is divided into 100 sec bins |
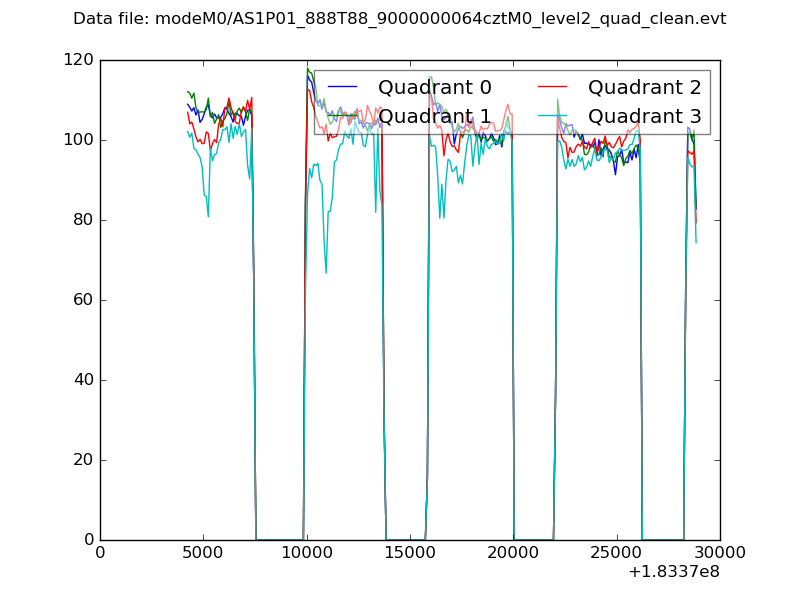 |
|
| Module-wise count rates for Quadrant A Data is divided into 100 sec bins |
 |
 |
| Module-wise count rates for Quadrant B Data is divided into 100 sec bins |
 |
 |
| Module-wise count rates for Quadrant C Data is divided into 100 sec bins |
 |
 |
| Module-wise count rates for Quadrant D Data is divided into 100 sec bins |
 |
 |
| Parameter | Plot |
|---|---|
| CZT HV Monitor |  |
| D_VDD | 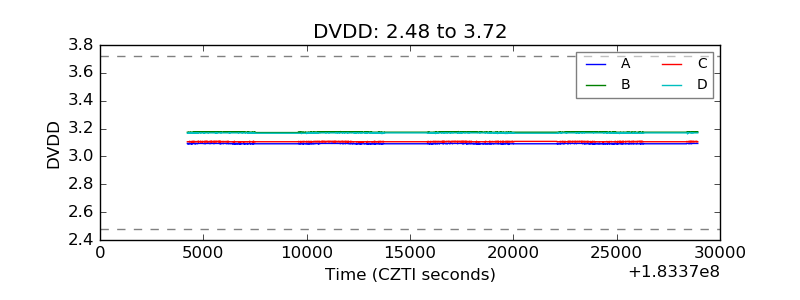 |
| Temperature 1 |  |
| Veto HV Monitor |  |
| Veto LLD |  |
| Alpha Counter | 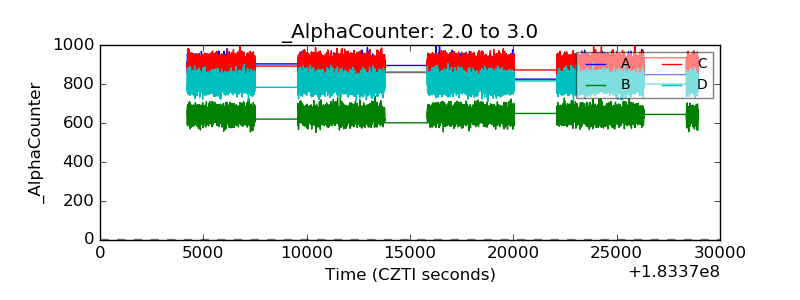 |
| _CPM_Rate |  |
| CZT Counter |  |
| +2.5 Volts monitor | 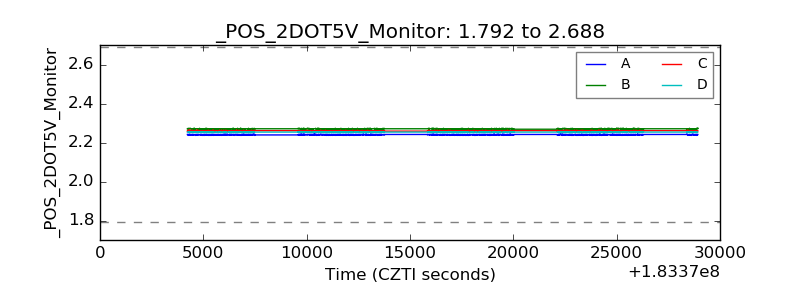 |
| +5 Volts monitor |  |
| _ROLL_ROT |  |
| _Roll_DEC |  |
| _Roll_RA |  |
| Veto Counter |  |