| Param | Original file | Final file |
|---|---|---|
| Filename | modeM0/AS1P01_161T05_9000000062cztM0_level2_bc.evt | modeM0/AS1P01_161T05_9000000062cztM0_level2_quad_clean.evt |
| Size (bytes) | 306,192,960 | 111,006,720 |
| Size | 292.0 MB | 105.9 MB |
| Events in quadrant A | 1,857,939 | 705,665 |
| Events in quadrant B | 1,870,275 | 713,005 |
| Events in quadrant C | 1,822,226 | 692,681 |
| Events in quadrant D | 3,139,592 | 663,608 |
| Mode M0 | |||
|---|---|---|---|
| Quadrant | BADHDUFLAG | Total packets | Discarded packets |
| A | 0 | 37630 | 0 |
| B | 0 | 36787 | 0 |
| C | 0 | 34582 | 0 |
| D | 0 | 38926 | 0 |
| Mode M9 | |||
|---|---|---|---|
| Quadrant | BADHDUFLAG | Total packets | Discarded packets |
| A | 0 | 57 | 0 |
| B | 0 | 57 | 0 |
| C | 0 | 57 | 0 |
| D | 0 | 57 | 0 |
| Mode SS | |||
|---|---|---|---|
| Quadrant | BADHDUFLAG | Total packets | Discarded packets |
| A | 0 | 172 | 0 |
| B | 0 | 172 | 0 |
| C | 0 | 172 | 0 |
| D | 0 | 172 | 0 |
| Quadrant | Total seconds | Saturated seconds | Saturation percentage |
|---|---|---|---|
| A | 8457 | 6 | 0.070947% |
| B | 8457 | 6 | 0.070947% |
| C | 8457 | 35 | 0.413858% |
| D | 8457 | 231 | 2.731465% |
Noise dominated data is calculated using 1-second bins in cleaned event files. If a bin has >2000 counts, and if more than 50% of those come from <1% of pixels, then it is considered to be noise-dominated and hence unusable.
| Quadrant | # 1 sec bins | Bins with >0 counts | Bins with >2000 counts | High rate bins dominated by noise | Noise dominated (total time) | Noise dominated (detector-on time) | Marked lightcurve |
|---|---|---|---|---|---|---|---|
| A | 12792 | 8457 | 0 | 0 | 0.00% | 0.00% |  |
| B | 12792 | 8457 | 0 | 0 | 0.00% | 0.00% |  |
| C | 12792 | 8457 | 5 | 5 | 0.04% | 0.06% |  |
| D | 12792 | 8454 | 24 | 24 | 0.19% | 0.28% |  |
Top three noisy pixels from each quadrant. If the there are fewer than three noisy pixels in the level2.evt file, extra rows are filled as -1
| Pixel properties | Quadrant properties | ||||||
|---|---|---|---|---|---|---|---|
| Quadrant | DetID | PixID | Counts | Sigma | Mean | Median | Sigma |
| A | 0 | 238 | 222228 | 2729.7 | 389 | 381 | 81.3 |
| A | 12 | 243 | 39694 | 483.72 | 389 | 381 | 81.3 |
| A | 13 | 17 | 25877 | 313.71 | 389 | 381 | 81.3 |
| B | 4 | 82 | 46021 | 643.61 | 399 | 388 | 70.9 |
| B | 7 | 221 | 36078 | 503.38 | 399 | 388 | 70.9 |
| B | 12 | 52 | 28619 | 398.17 | 399 | 388 | 70.9 |
| C | 3 | 159 | 142738 | 1746.19 | 379 | 373 | 81.5 |
| C | 2 | 53 | 74190 | 905.41 | 379 | 373 | 81.5 |
| C | 9 | 170 | 73538 | 897.41 | 379 | 373 | 81.5 |
| D | 13 | 7 | 667397 | 8028.23 | 374 | 365 | 83.1 |
| D | 1 | 5 | 194367 | 2334.96 | 374 | 365 | 83.1 |
| D | 1 | 13 | 88044 | 1055.28 | 374 | 365 | 83.1 |
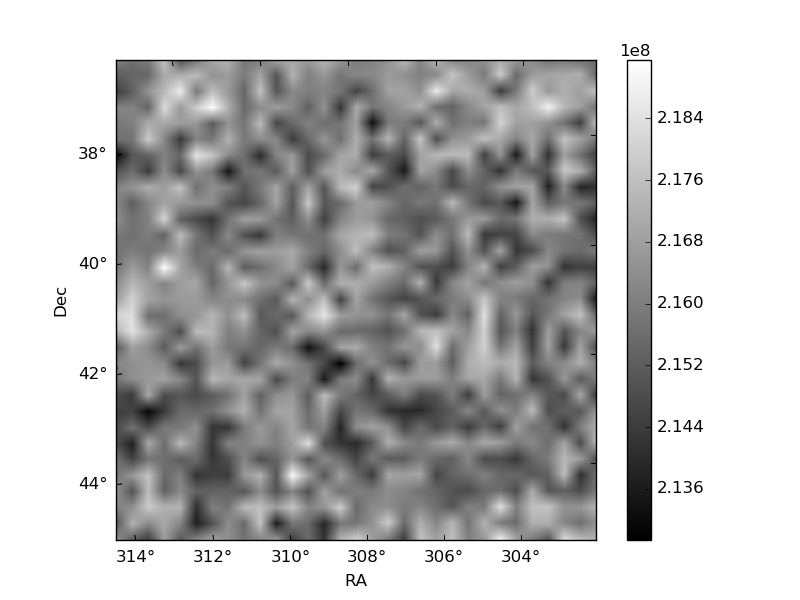
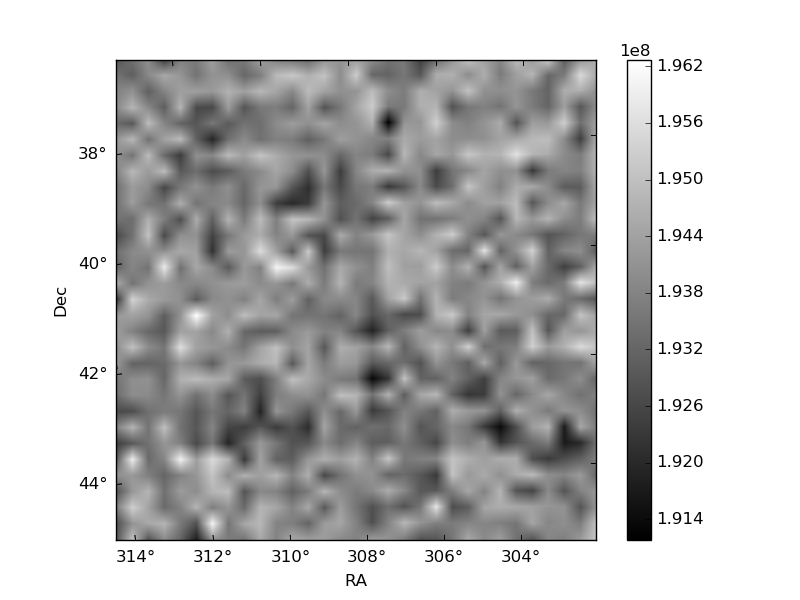
Histogram calculated using DETX and DETY for each event in the final _common_clean file
| Quadrant A | 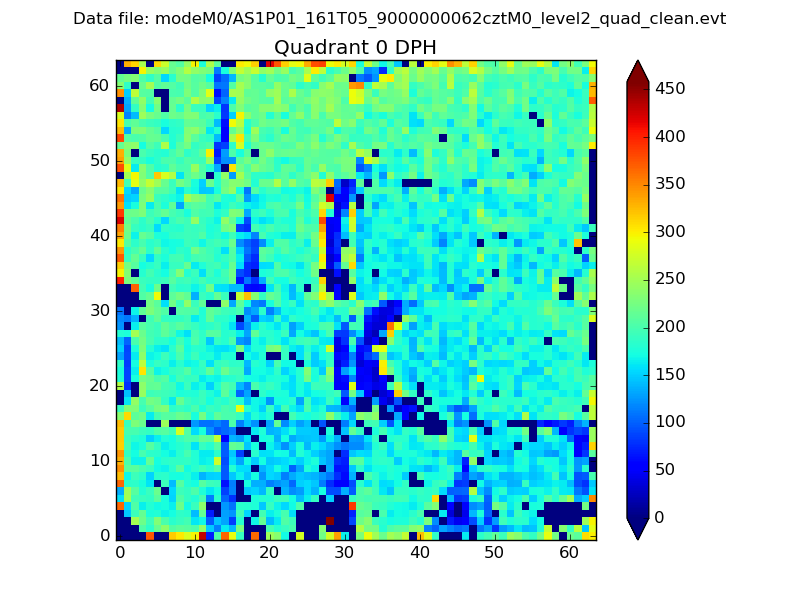 |
 |
Quadrant B |
|---|---|---|---|
| Quadrant D |  |
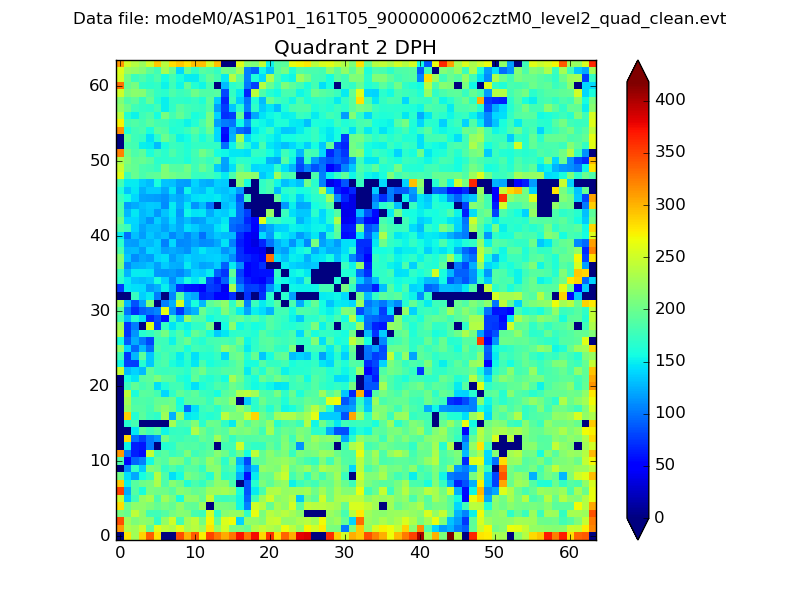 |
Quadrant C |
| Plot type | Count rate plots | Images |
|---|---|---|
| Comparison with Poisson distribution Blue bars denote a histogram of data divided into 1 sec bins. Red curve is a Poisson curve with rate = median count rate of data. |
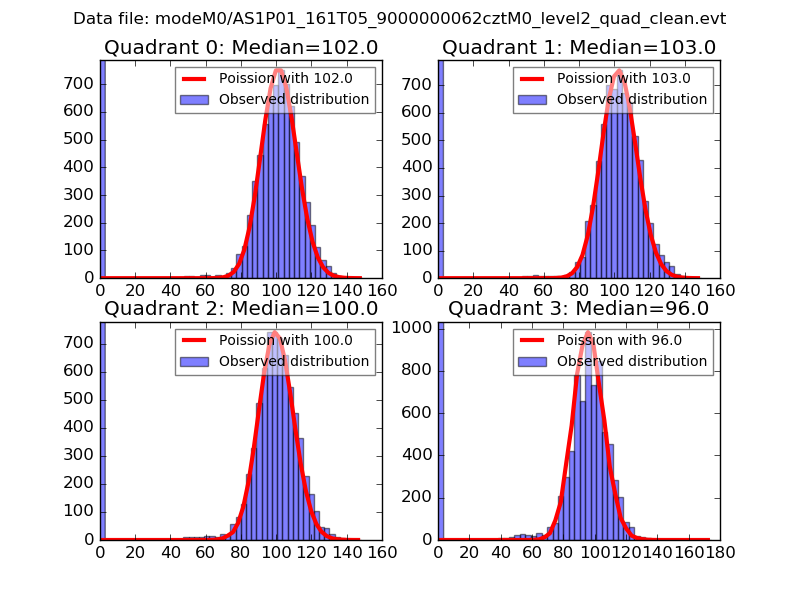 |
 |
| Quadrant-wise count rates Data is divided into 100 sec bins |
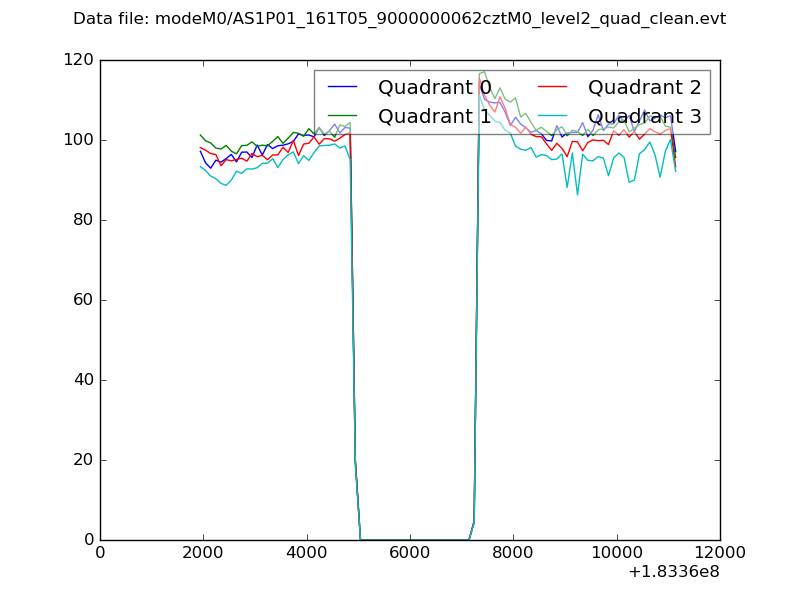 |
|
| Module-wise count rates for Quadrant A Data is divided into 100 sec bins |
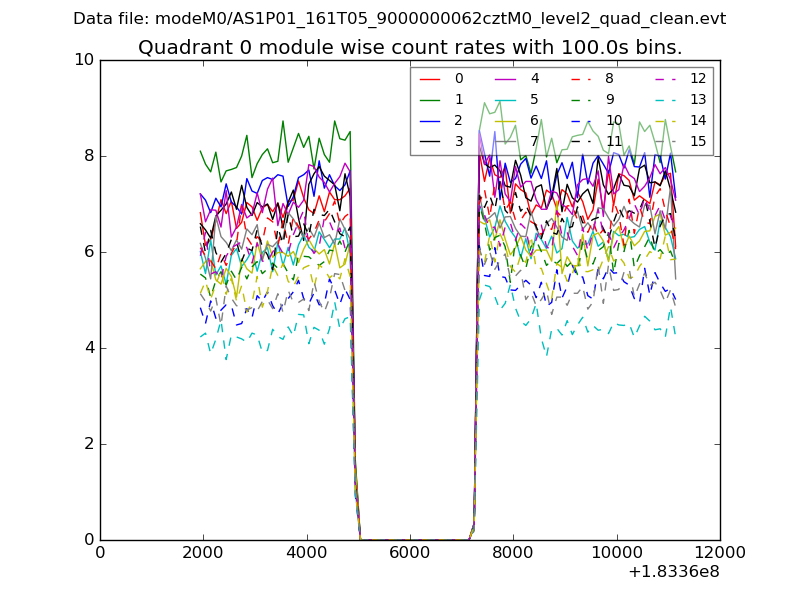 |
 |
| Module-wise count rates for Quadrant B Data is divided into 100 sec bins |
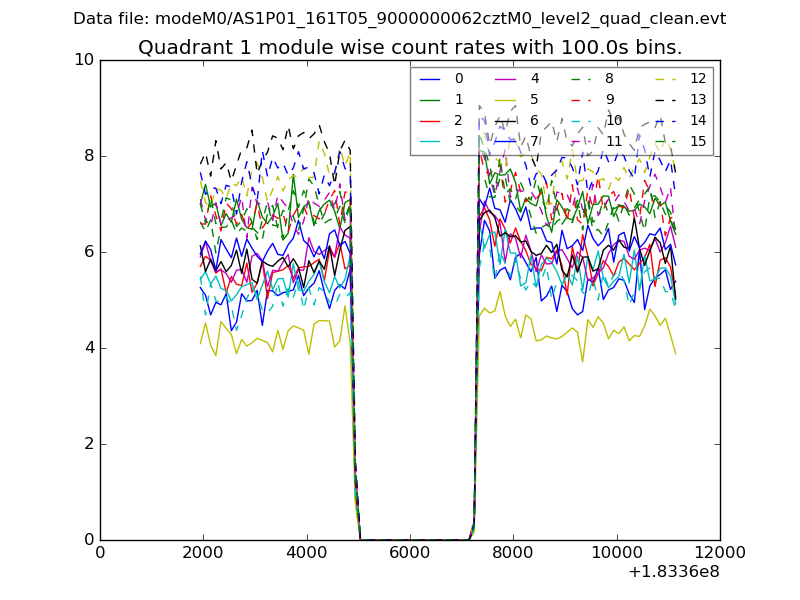 |
 |
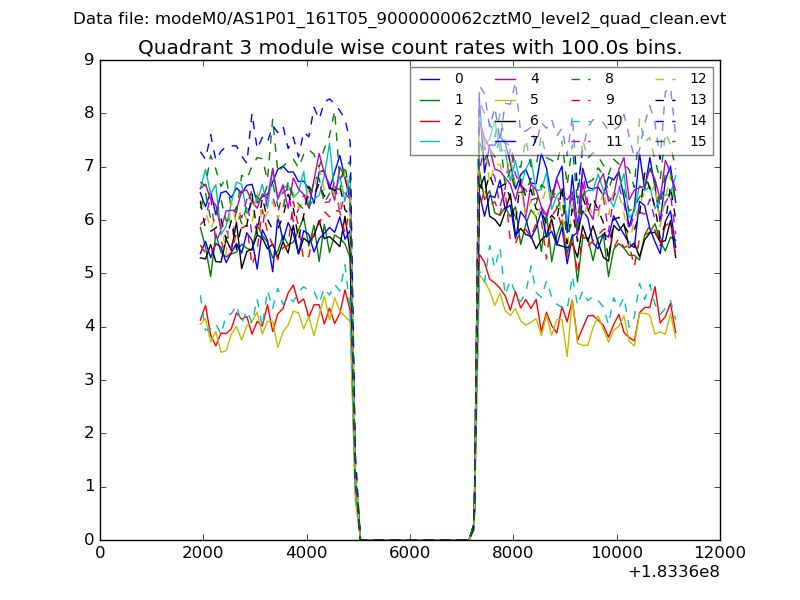
| Module-wise count rates for Quadrant C Data is divided into 100 sec bins |
 |
 |
| Module-wise count rates for Quadrant D Data is divided into 100 sec bins |
 |
 |
| Parameter | Plot |
|---|---|
| CZT HV Monitor |  |
| D_VDD |  |
| Temperature 1 |  |
| Veto HV Monitor |  |
| Veto LLD |  |
| Alpha Counter |  |
| _CPM_Rate |  |
| CZT Counter |  |
| +2.5 Volts monitor |  |
| +5 Volts monitor | 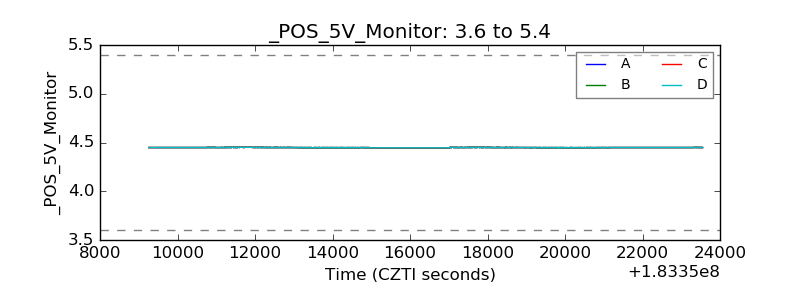 |
| Veto Counter |  |