| Param | Original file | Final file |
|---|---|---|
| Filename | modeM0/AS1P01_163T03_9000000056cztM0_level2_bc.evt | modeM0/AS1P01_163T03_9000000056cztM0_level2_quad_clean.evt |
| Size (bytes) | 694,920,960 | 142,764,480 |
| Size | 662.7 MB | 136.2 MB |
| Events in quadrant A | 5,178,653 | 849,522 |
| Events in quadrant B | 5,435,992 | 835,114 |
| Events in quadrant C | 4,402,304 | 848,919 |
| Events in quadrant D | 5,077,216 | 829,356 |
| Mode M9 | |||
|---|---|---|---|
| Quadrant | BADHDUFLAG | Total packets | Discarded packets |
| A | 0 | 83 | 0 |
| B | 0 | 83 | 0 |
| C | 0 | 83 | 0 |
| D | 0 | 83 | 0 |
| Mode SS | |||
|---|---|---|---|
| Quadrant | BADHDUFLAG | Total packets | Discarded packets |
| A | 0 | 288 | 0 |
| B | 0 | 288 | 0 |
| C | 0 | 288 | 0 |
| D | 0 | 288 | 0 |
| Mode M0 | |||
|---|---|---|---|
| Quadrant | BADHDUFLAG | Total packets | Discarded packets |
| A | 0 | 69231 | 0 |
| B | 0 | 67656 | 0 |
| C | 0 | 60806 | 0 |
| D | 0 | 61469 | 0 |
| Quadrant | Total seconds | Saturated seconds | Saturation percentage |
|---|---|---|---|
| A | 13894 | 586 | 4.217648% |
| B | 13894 | 1081 | 7.780337% |
| C | 13894 | 76 | 0.546999% |
| D | 13894 | 157 | 1.129984% |
Noise dominated data is calculated using 1-second bins in cleaned event files. If a bin has >2000 counts, and if more than 50% of those come from <1% of pixels, then it is considered to be noise-dominated and hence unusable.
| Quadrant | # 1 sec bins | Bins with >0 counts | Bins with >2000 counts | High rate bins dominated by noise | Noise dominated (total time) | Noise dominated (detector-on time) | Marked lightcurve |
|---|---|---|---|---|---|---|---|
| A | 20539 | 13894 | 95 | 95 | 0.46% | 0.68% |  |
| B | 20539 | 13894 | 864 | 864 | 4.21% | 6.22% |  |
| C | 20539 | 13894 | 19 | 19 | 0.09% | 0.14% |  |
| D | 20539 | 13894 | 41 | 41 | 0.20% | 0.30% |  |
Top three noisy pixels from each quadrant. If the there are fewer than three noisy pixels in the level2.evt file, extra rows are filled as -1
| Pixel properties | Quadrant properties | ||||||
|---|---|---|---|---|---|---|---|
| Quadrant | DetID | PixID | Counts | Sigma | Mean | Median | Sigma |
| A | 0 | 69 | 1635700 | 12832.89 | 624 | 613 | 127.4 |
| A | 15 | 127 | 346749 | 2716.63 | 624 | 613 | 127.4 |
| A | 0 | 238 | 312061 | 2444.38 | 624 | 613 | 127.4 |
| B | 5 | 176 | 2048814 | 18266.57 | 635 | 619 | 112.1 |
| B | 2 | 2 | 508241 | 4527.16 | 635 | 619 | 112.1 |
| B | 0 | 230 | 53830 | 474.55 | 635 | 619 | 112.1 |
| C | 10 | 107 | 1409239 | 10561.38 | 626 | 618 | 133.4 |
| C | 3 | 159 | 378856 | 2835.91 | 626 | 618 | 133.4 |
| C | 14 | 206 | 48628 | 359.96 | 626 | 618 | 133.4 |
| D | 7 | 85 | 562522 | 4074.99 | 622 | 607 | 137.9 |
| D | 1 | 5 | 557920 | 4041.61 | 622 | 607 | 137.9 |
| D | 1 | 4 | 160072 | 1156.43 | 622 | 607 | 137.9 |
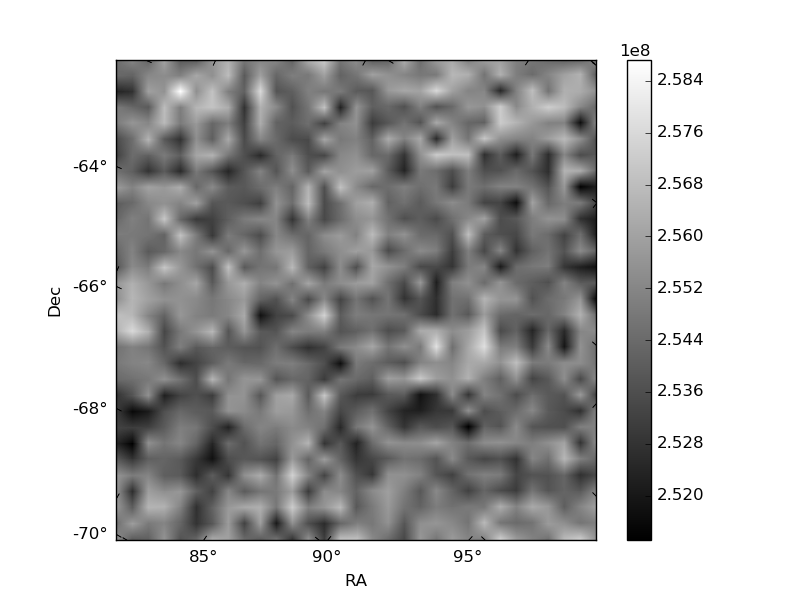
Histogram calculated using DETX and DETY for each event in the final _common_clean file
| Quadrant A |  |
 |
Quadrant B |
|---|---|---|---|
| Quadrant D |  |
 |
Quadrant C |
| Plot type | Count rate plots | Images |
|---|---|---|
| Comparison with Poisson distribution Blue bars denote a histogram of data divided into 1 sec bins. Red curve is a Poisson curve with rate = median count rate of data. |
 |
 |
| Quadrant-wise count rates Data is divided into 100 sec bins |
 |
|
| Module-wise count rates for Quadrant A Data is divided into 100 sec bins |
 |
 |
| Module-wise count rates for Quadrant B Data is divided into 100 sec bins |
 |
 |
| Module-wise count rates for Quadrant C Data is divided into 100 sec bins |
 |
 |
| Module-wise count rates for Quadrant D Data is divided into 100 sec bins |
 |
 |
| Parameter | Plot |
|---|---|
| CZT HV Monitor |  |
| D_VDD |  |
| Temperature 1 | 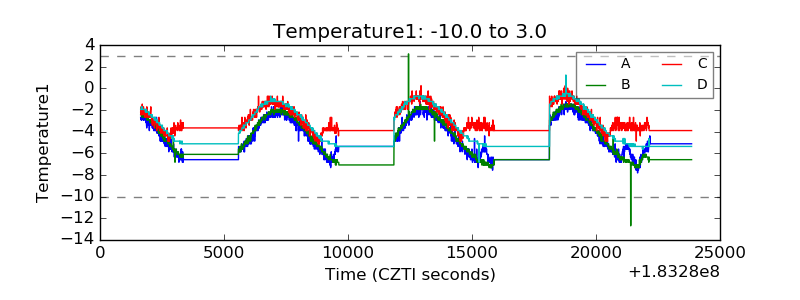 |
| Veto HV Monitor |  |
| Veto LLD |  |
| Alpha Counter |  |
| _CPM_Rate |  |
| CZT Counter |  |
| +2.5 Volts monitor |  |
| +5 Volts monitor |  |
| _ROLL_ROT |  |
| _Roll_DEC |  |
| _Roll_RA |  |
| Veto Counter | 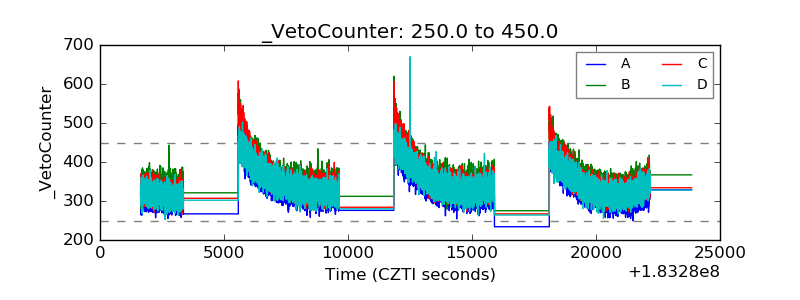 |