| Param | Original file | Final file |
|---|---|---|
| Filename | modeM0/AS1P01_161T05_9000000058cztM0_level2_bc.evt | modeM0/AS1P01_161T05_9000000058cztM0_level2_quad_clean.evt |
| Size (bytes) | 1,397,168,640 | 268,833,600 |
| Size | 1.3 GB | 256.4 MB |
| Events in quadrant A | 7,771,707 | 1,490,467 |
| Events in quadrant B | 6,479,409 | 1,510,843 |
| Events in quadrant C | 10,803,314 | 1,485,451 |
| Events in quadrant D | 14,993,659 | 1,371,177 |
| Mode M0 | |||
|---|---|---|---|
| Quadrant | BADHDUFLAG | Total packets | Discarded packets |
| A | 0 | 145525 | 0 |
| B | 0 | 139661 | 0 |
| C | 0 | 145474 | 0 |
| D | 0 | 159478 | 0 |
| Mode SS | |||
|---|---|---|---|
| Quadrant | BADHDUFLAG | Total packets | Discarded packets |
| A | 0 | 678 | 0 |
| B | 0 | 678 | 0 |
| C | 0 | 678 | 0 |
| D | 0 | 678 | 0 |
| Mode M9 | |||
|---|---|---|---|
| Quadrant | BADHDUFLAG | Total packets | Discarded packets |
| A | 0 | 176 | 0 |
| B | 0 | 176 | 0 |
| C | 0 | 176 | 0 |
| D | 0 | 176 | 0 |
| Quadrant | Total seconds | Saturated seconds | Saturation percentage |
|---|---|---|---|
| A | 33228 | 452 | 1.360299% |
| B | 33228 | 45 | 0.135428% |
| C | 33228 | 380 | 1.143614% |
| D | 33228 | 2073 | 6.238714% |
Noise dominated data is calculated using 1-second bins in cleaned event files. If a bin has >2000 counts, and if more than 50% of those come from <1% of pixels, then it is considered to be noise-dominated and hence unusable.
| Quadrant | # 1 sec bins | Bins with >0 counts | Bins with >2000 counts | High rate bins dominated by noise | Noise dominated (total time) | Noise dominated (detector-on time) | Marked lightcurve |
|---|---|---|---|---|---|---|---|
| A | 50646 | 33228 | 108 | 108 | 0.21% | 0.33% | 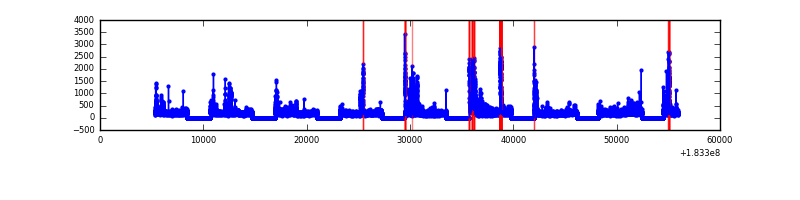 |
| B | 50646 | 33229 | 8 | 8 | 0.02% | 0.02% |  |
| C | 50646 | 33228 | 207 | 207 | 0.41% | 0.62% |  |
| D | 50646 | 33229 | 290 | 290 | 0.57% | 0.87% |  |
Top three noisy pixels from each quadrant. If the there are fewer than three noisy pixels in the level2.evt file, extra rows are filled as -1
| Pixel properties | Quadrant properties | ||||||
|---|---|---|---|---|---|---|---|
| Quadrant | DetID | PixID | Counts | Sigma | Mean | Median | Sigma |
| A | 0 | 69 | 1347238 | 4641.4 | 1363 | 1332 | 290.0 |
| A | 0 | 238 | 463825 | 1594.92 | 1363 | 1332 | 290.0 |
| A | 12 | 243 | 244871 | 839.85 | 1363 | 1332 | 290.0 |
| B | 0 | 207 | 109010 | 423.38 | 1402 | 1354 | 254.3 |
| B | 0 | 230 | 104053 | 403.89 | 1402 | 1354 | 254.3 |
| B | 0 | 182 | 85952 | 332.7 | 1402 | 1354 | 254.3 |
| C | 1 | 1 | 3001819 | 10333.82 | 1357 | 1332 | 290.4 |
| C | 10 | 107 | 1647569 | 5669.72 | 1357 | 1332 | 290.4 |
| C | 3 | 159 | 415714 | 1427.15 | 1357 | 1332 | 290.4 |
| D | 13 | 7 | 5445834 | 18428.16 | 1315 | 1275 | 295.4 |
| D | 7 | 85 | 1061619 | 3588.94 | 1315 | 1275 | 295.4 |
| D | 1 | 5 | 437999 | 1478.18 | 1315 | 1275 | 295.4 |
Histogram calculated using DETX and DETY for each event in the final _common_clean file
| Quadrant A |  |
 |
Quadrant B |
|---|---|---|---|
| Quadrant D |  |
 |
Quadrant C |
| Plot type | Count rate plots | Images |
|---|---|---|
| Comparison with Poisson distribution Blue bars denote a histogram of data divided into 1 sec bins. Red curve is a Poisson curve with rate = median count rate of data. |
 |
 |
| Quadrant-wise count rates Data is divided into 100 sec bins |
 |
|
| Module-wise count rates for Quadrant A Data is divided into 100 sec bins |
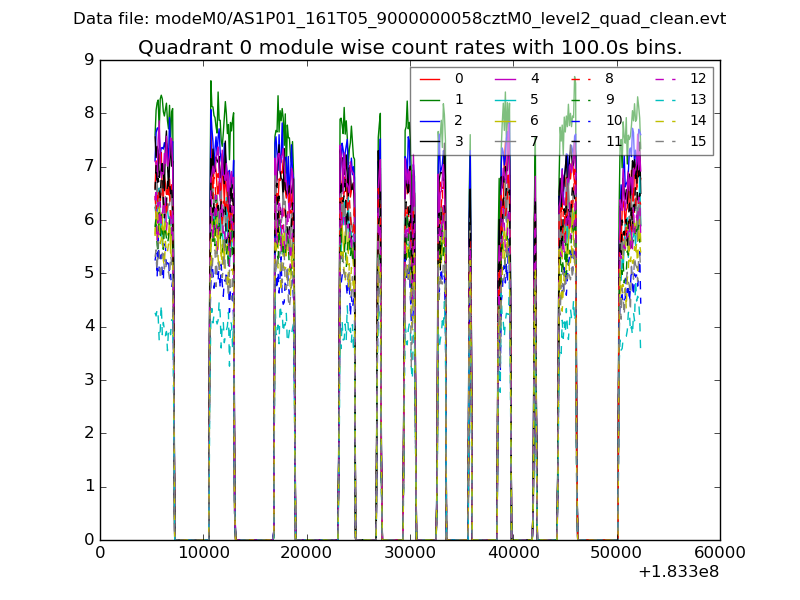 |
 |
| Module-wise count rates for Quadrant B Data is divided into 100 sec bins |
 |
 |
| Module-wise count rates for Quadrant C Data is divided into 100 sec bins |
 |
 |
| Module-wise count rates for Quadrant D Data is divided into 100 sec bins |
 |
 |
| Parameter | Plot |
|---|---|
| CZT HV Monitor |  |
| D_VDD | 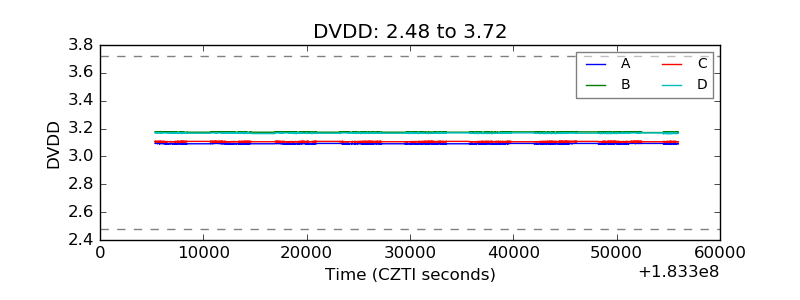 |
| Temperature 1 |  |
| Veto HV Monitor | 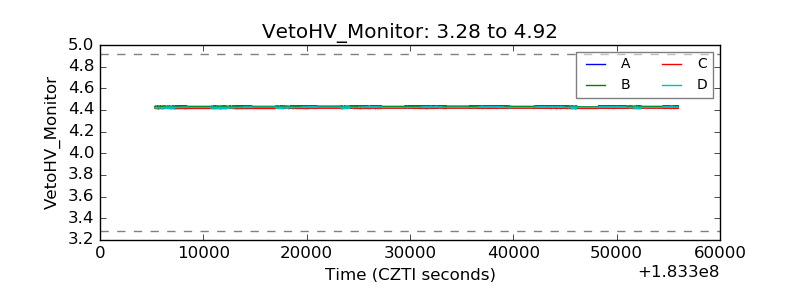 |
| Veto LLD |  |
| Alpha Counter | 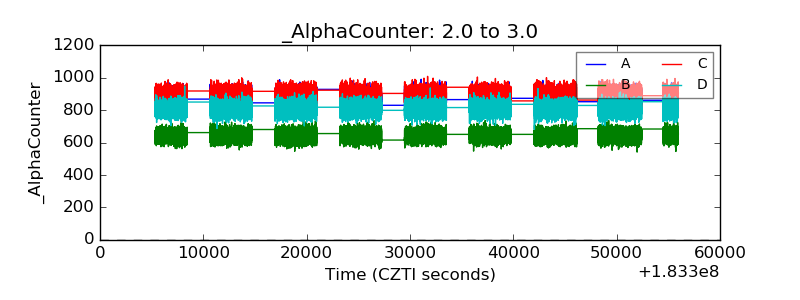 |
| _CPM_Rate |  |
| CZT Counter |  |
| +2.5 Volts monitor |  |
| +5 Volts monitor |  |
| _ROLL_ROT |  |
| _Roll_DEC |  |
| _Roll_RA |  |
| Veto Counter | 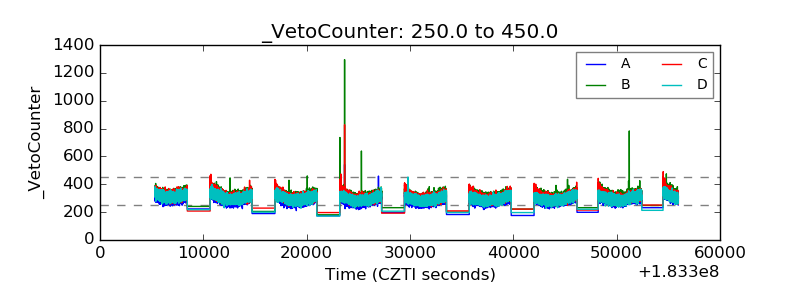 |