| Param | Original file | Final file |
|---|---|---|
| Filename | modeM0/AS1P01_161T03_9000000054cztM0_level2_bc.evt | modeM0/AS1P01_161T03_9000000054cztM0_level2_quad_clean.evt |
| Size (bytes) | 288,034,560 | 87,223,680 |
| Size | 274.7 MB | 83.2 MB |
| Events in quadrant A | 2,344,959 | 535,000 |
| Events in quadrant B | 2,259,655 | 536,691 |
| Events in quadrant C | 1,403,605 | 536,866 |
| Events in quadrant D | 2,203,875 | 517,828 |
| Mode M0 | |||
|---|---|---|---|
| Quadrant | BADHDUFLAG | Total packets | Discarded packets |
| A | 0 | 35796 | 0 |
| B | 0 | 34745 | 0 |
| C | 0 | 29482 | 0 |
| D | 0 | 31566 | 0 |
| Mode M9 | |||
|---|---|---|---|
| Quadrant | BADHDUFLAG | Total packets | Discarded packets |
| A | 0 | 44 | 0 |
| B | 0 | 44 | 0 |
| C | 0 | 44 | 0 |
| D | 0 | 44 | 0 |
| Mode SS | |||
|---|---|---|---|
| Quadrant | BADHDUFLAG | Total packets | Discarded packets |
| A | 0 | 154 | 0 |
| B | 0 | 154 | 0 |
| C | 0 | 154 | 0 |
| D | 0 | 154 | 0 |
| Quadrant | Total seconds | Saturated seconds | Saturation percentage |
|---|---|---|---|
| A | 7393 | 69 | 0.933315% |
| B | 7393 | 189 | 2.556472% |
| C | 7393 | 5 | 0.067632% |
| D | 7393 | 13 | 0.175842% |
Noise dominated data is calculated using 1-second bins in cleaned event files. If a bin has >2000 counts, and if more than 50% of those come from <1% of pixels, then it is considered to be noise-dominated and hence unusable.
| Quadrant | # 1 sec bins | Bins with >0 counts | Bins with >2000 counts | High rate bins dominated by noise | Noise dominated (total time) | Noise dominated (detector-on time) | Marked lightcurve |
|---|---|---|---|---|---|---|---|
| A | 11882 | 7393 | 8 | 8 | 0.07% | 0.11% | 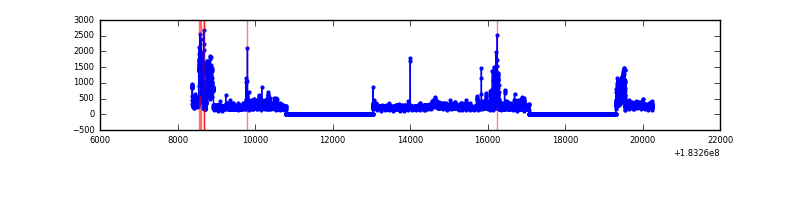 |
| B | 11882 | 7393 | 25 | 25 | 0.21% | 0.34% |  |
| C | 11882 | 7393 | 0 | 0 | 0.00% | 0.00% |  |
| D | 11882 | 7393 | 2 | 2 | 0.02% | 0.03% |  |
Top three noisy pixels from each quadrant. If the there are fewer than three noisy pixels in the level2.evt file, extra rows are filled as -1
| Pixel properties | Quadrant properties | ||||||
|---|---|---|---|---|---|---|---|
| Quadrant | DetID | PixID | Counts | Sigma | Mean | Median | Sigma |
| A | 12 | 149 | 329078 | 4777.22 | 322 | 315 | 68.8 |
| A | 0 | 69 | 259941 | 3772.6 | 322 | 315 | 68.8 |
| A | 15 | 127 | 186843 | 2710.42 | 322 | 315 | 68.8 |
| B | 2 | 2 | 542719 | 8876.63 | 328 | 318 | 61.1 |
| B | 0 | 230 | 185117 | 3024.32 | 328 | 318 | 61.1 |
| B | 0 | 207 | 76134 | 1240.76 | 328 | 318 | 61.1 |
| C | 1 | 1 | 84744 | 1237.87 | 318 | 314 | 68.2 |
| C | 14 | 206 | 25920 | 375.42 | 318 | 314 | 68.2 |
| C | 9 | 206 | 7731 | 108.74 | 318 | 314 | 68.2 |
| D | 7 | 85 | 384843 | 5419.35 | 315 | 306 | 71.0 |
| D | 1 | 5 | 157933 | 2221.46 | 315 | 306 | 71.0 |
| D | 13 | 216 | 59294 | 831.33 | 315 | 306 | 71.0 |
Histogram calculated using DETX and DETY for each event in the final _common_clean file
| Quadrant A |  |
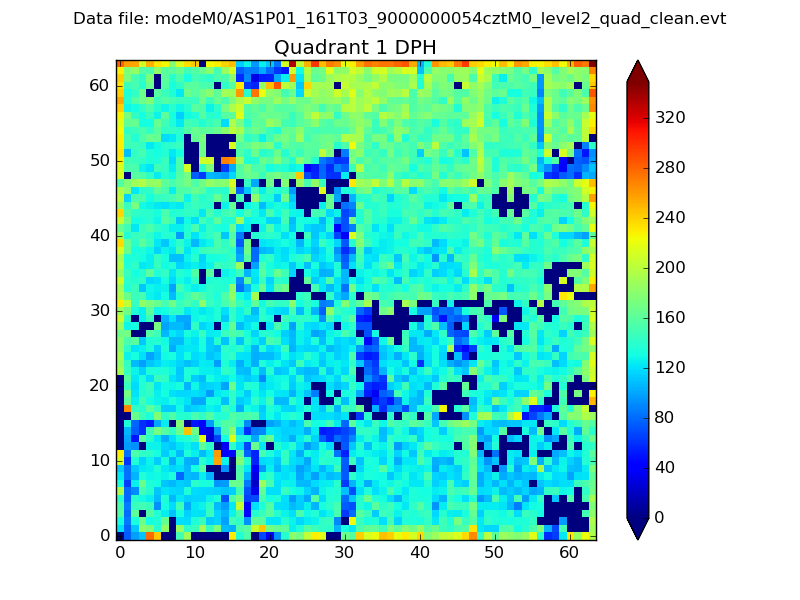 |
Quadrant B |
|---|---|---|---|
| Quadrant D |  |
 |
Quadrant C |
| Plot type | Count rate plots | Images |
|---|---|---|
| Comparison with Poisson distribution Blue bars denote a histogram of data divided into 1 sec bins. Red curve is a Poisson curve with rate = median count rate of data. |
 |
 |
| Quadrant-wise count rates Data is divided into 100 sec bins |
 |
|
| Module-wise count rates for Quadrant A Data is divided into 100 sec bins |
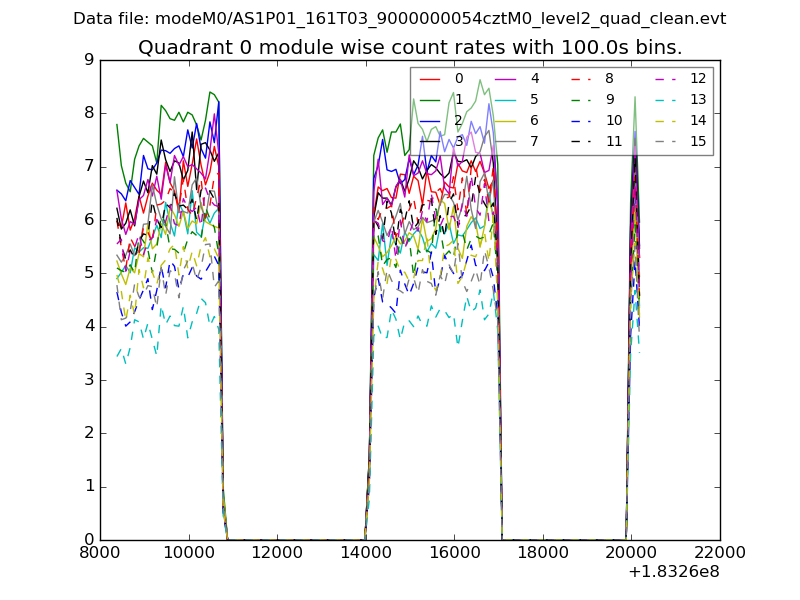 |
 |
| Module-wise count rates for Quadrant B Data is divided into 100 sec bins |
 |
 |
| Module-wise count rates for Quadrant C Data is divided into 100 sec bins |
 |
 |
| Module-wise count rates for Quadrant D Data is divided into 100 sec bins |
 |
 |
| Parameter | Plot |
|---|---|
| CZT HV Monitor | 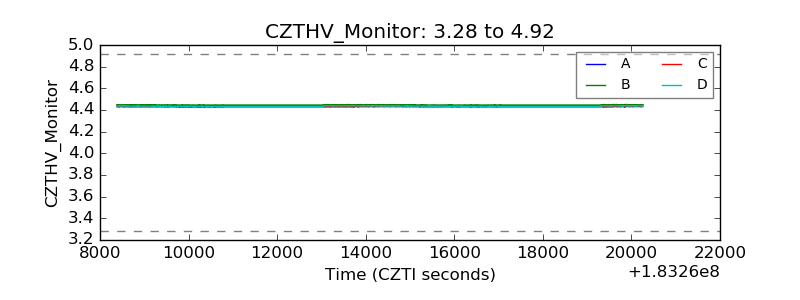 |
| D_VDD |  |
| Temperature 1 |  |
| Veto HV Monitor |  |
| Veto LLD | 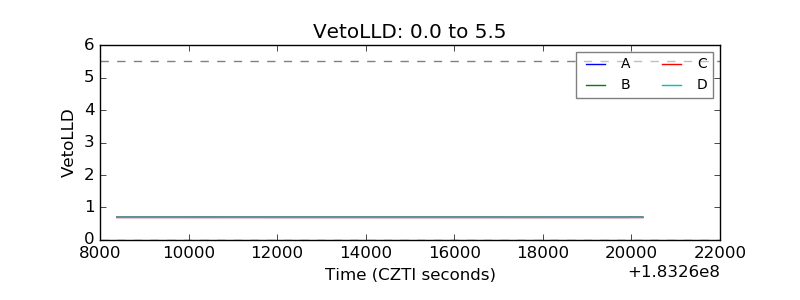 |
| Alpha Counter |  |
| _CPM_Rate |  |
| CZT Counter |  |
| +2.5 Volts monitor | 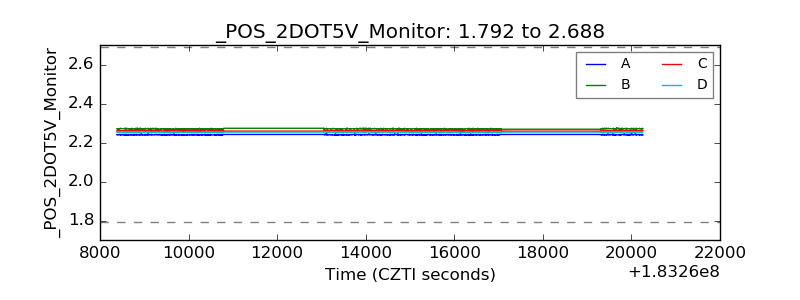 |
| +5 Volts monitor |  |
| _ROLL_ROT |  |
| _Roll_DEC |  |
| _Roll_RA |  |
| Veto Counter | 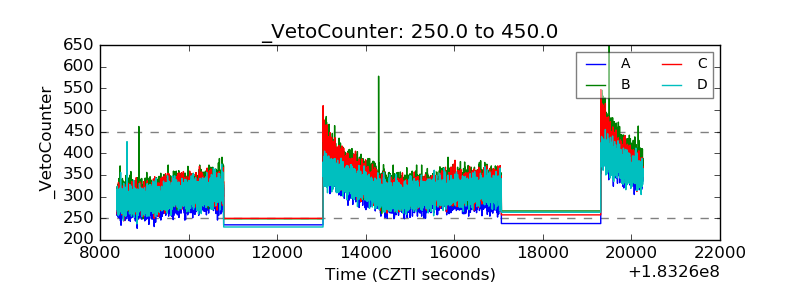 |