| Param | Original file | Final file |
|---|---|---|
| Filename | modeM0/AS1P01_162T05_9000000052cztM0_level2_bc.evt | modeM0/AS1P01_162T05_9000000052cztM0_level2_quad_clean.evt |
| Size (bytes) | 1,809,616,320 | 302,071,680 |
| Size | 1.7 GB | 288.1 MB |
| Events in quadrant A | 6,029,124 | 1,940,062 |
| Events in quadrant B | 33,534,076 | 1,579,784 |
| Events in quadrant C | 5,001,579 | 1,907,267 |
| Events in quadrant D | 8,370,776 | 1,833,069 |
| Mode M9 | |||
|---|---|---|---|
| Quadrant | BADHDUFLAG | Total packets | Discarded packets |
| A | 0 | 158 | 0 |
| B | 0 | 158 | 0 |
| C | 0 | 158 | 0 |
| D | 0 | 158 | 0 |
| Mode M0 | |||
|---|---|---|---|
| Quadrant | BADHDUFLAG | Total packets | Discarded packets |
| A | 0 | 116137 | 0 |
| B | 0 | 218054 | 0 |
| C | 0 | 107960 | 0 |
| D | 0 | 112904 | 0 |
| Mode SS | |||
|---|---|---|---|
| Quadrant | BADHDUFLAG | Total packets | Discarded packets |
| A | 0 | 560 | 0 |
| B | 0 | 560 | 0 |
| C | 0 | 560 | 0 |
| D | 0 | 560 | 0 |
| Quadrant | Total seconds | Saturated seconds | Saturation percentage |
|---|---|---|---|
| A | 27405 | 58 | 0.211640% |
| B | 27405 | 13221 | 48.243021% |
| C | 27405 | 35 | 0.127714% |
| D | 27405 | 621 | 2.266010% |
Noise dominated data is calculated using 1-second bins in cleaned event files. If a bin has >2000 counts, and if more than 50% of those come from <1% of pixels, then it is considered to be noise-dominated and hence unusable.
| Quadrant | # 1 sec bins | Bins with >0 counts | Bins with >2000 counts | High rate bins dominated by noise | Noise dominated (total time) | Noise dominated (detector-on time) | Marked lightcurve |
|---|---|---|---|---|---|---|---|
| A | 43122 | 27405 | 8 | 8 | 0.02% | 0.03% |  |
| B | 43122 | 27405 | 2167 | 2167 | 5.03% | 7.91% |  |
| C | 43122 | 27406 | 8 | 8 | 0.02% | 0.03% |  |
| D | 43122 | 27405 | 415 | 415 | 0.96% | 1.51% |  |
Top three noisy pixels from each quadrant. If the there are fewer than three noisy pixels in the level2.evt file, extra rows are filled as -1
| Pixel properties | Quadrant properties | ||||||
|---|---|---|---|---|---|---|---|
| Quadrant | DetID | PixID | Counts | Sigma | Mean | Median | Sigma |
| A | 0 | 238 | 930308 | 3906.14 | 1123 | 1097 | 237.9 |
| A | 0 | 69 | 219072 | 916.31 | 1123 | 1097 | 237.9 |
| A | 15 | 127 | 97754 | 406.32 | 1123 | 1097 | 237.9 |
| B | 2 | 2 | 29143775 | 160903.63 | 964 | 933 | 181.1 |
| B | 0 | 207 | 77657 | 423.61 | 964 | 933 | 181.1 |
| B | 0 | 220 | 71258 | 388.28 | 964 | 933 | 181.1 |
| C | 1 | 1 | 175929 | 727.98 | 1119 | 1097 | 240.2 |
| C | 3 | 159 | 118622 | 489.36 | 1119 | 1097 | 240.2 |
| C | 14 | 206 | 73936 | 303.29 | 1119 | 1097 | 240.2 |
| D | 2 | 25 | 1418895 | 5820.23 | 1098 | 1064 | 243.6 |
| D | 7 | 85 | 634691 | 2601.06 | 1098 | 1064 | 243.6 |
| D | 2 | 89 | 341496 | 1397.48 | 1098 | 1064 | 243.6 |
Histogram calculated using DETX and DETY for each event in the final _common_clean file
| Quadrant A |  |
 |
Quadrant B |
|---|---|---|---|
| Quadrant D | 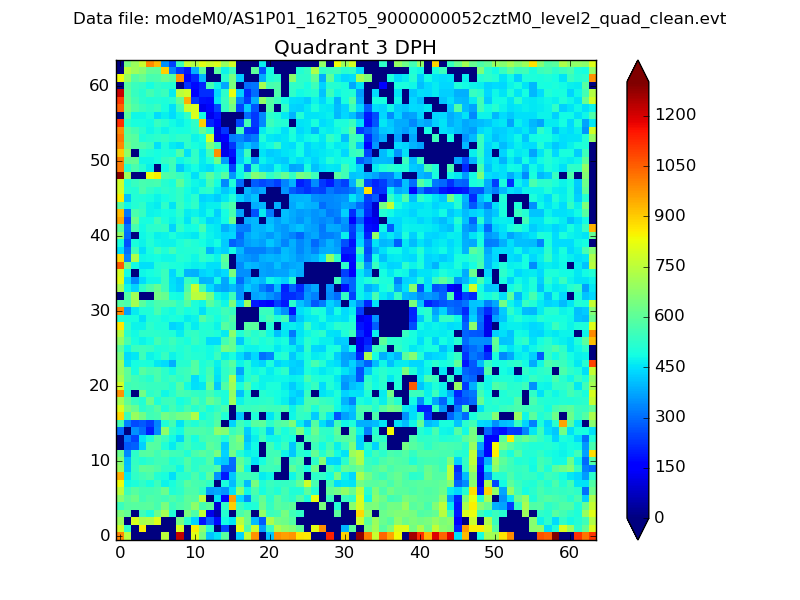 |
 |
Quadrant C |
| Plot type | Count rate plots | Images |
|---|---|---|
| Comparison with Poisson distribution Blue bars denote a histogram of data divided into 1 sec bins. Red curve is a Poisson curve with rate = median count rate of data. |
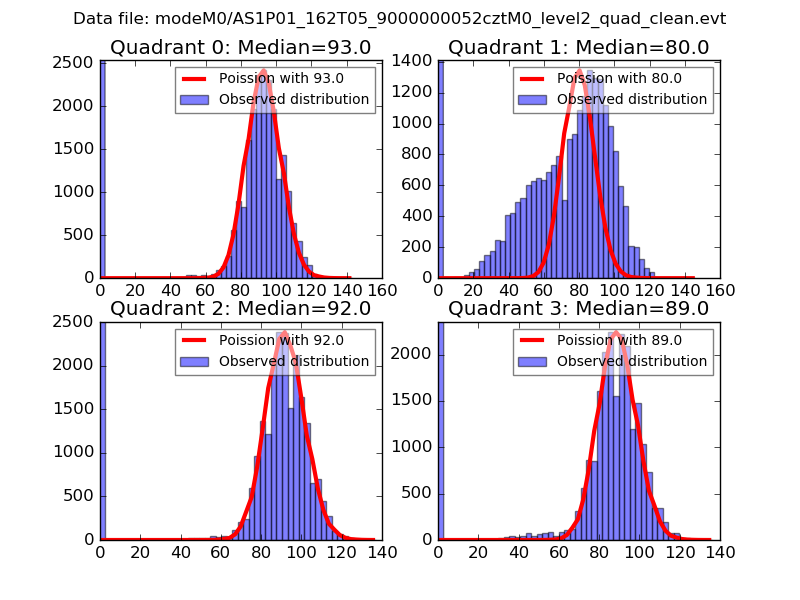 |
 |
| Quadrant-wise count rates Data is divided into 100 sec bins |
 |
|
| Module-wise count rates for Quadrant A Data is divided into 100 sec bins |
 |
 |
| Module-wise count rates for Quadrant B Data is divided into 100 sec bins |
 |
 |
| Module-wise count rates for Quadrant C Data is divided into 100 sec bins |
 |
 |
| Module-wise count rates for Quadrant D Data is divided into 100 sec bins |
 |
 |
| Parameter | Plot |
|---|---|
| CZT HV Monitor |  |
| D_VDD |  |
| Temperature 1 |  |
| Veto HV Monitor |  |
| Veto LLD |  |
| Alpha Counter | 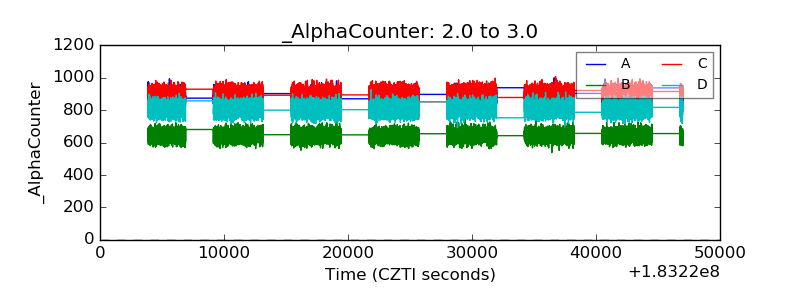 |
| _CPM_Rate |  |
| CZT Counter | 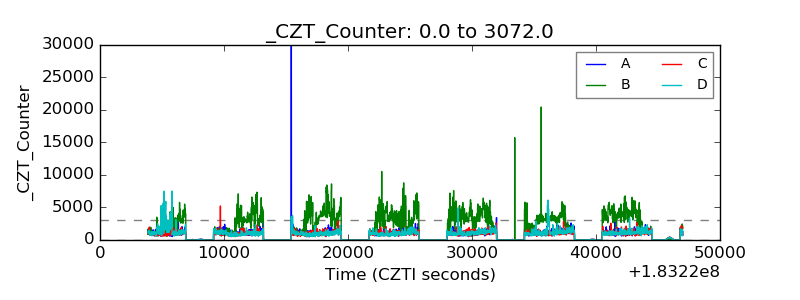 |
| +2.5 Volts monitor |  |
| +5 Volts monitor | 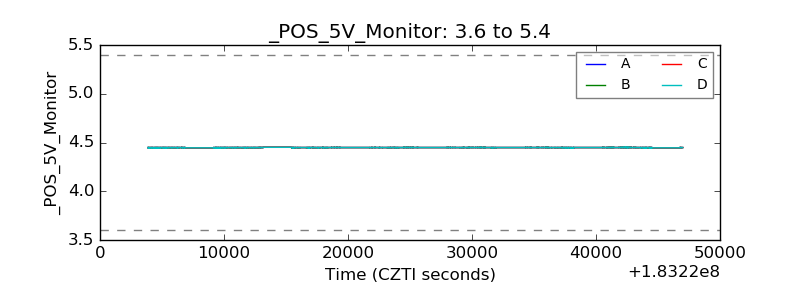 |
| _ROLL_ROT |  |
| _Roll_DEC | 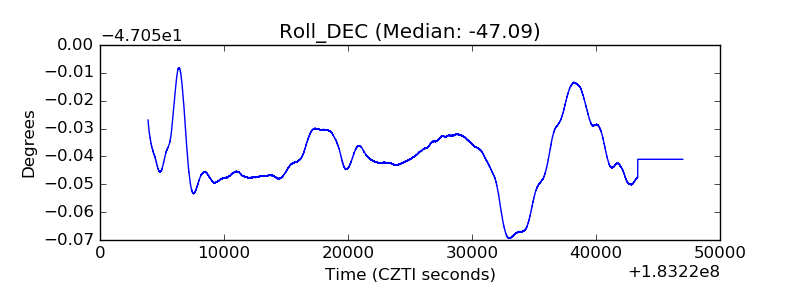 |
| _Roll_RA |  |
| Veto Counter |  |