| Param | Original file | Final file |
|---|---|---|
| Filename | modeM0/AS1P01_161T05_9000000050cztM0_level2_bc.evt | modeM0/AS1P01_161T05_9000000050cztM0_level2_quad_clean.evt |
| Size (bytes) | 313,551,360 | 47,309,760 |
| Size | 299.0 MB | 45.1 MB |
| Events in quadrant A | 4,487,280 | 275,687 |
| Events in quadrant B | 1,746,769 | 297,523 |
| Events in quadrant C | 902,792 | 297,672 |
| Events in quadrant D | 2,079,445 | 277,445 |
| Mode M0 | |||
|---|---|---|---|
| Quadrant | BADHDUFLAG | Total packets | Discarded packets |
| A | 0 | 28496 | 0 |
| B | 0 | 19911 | 0 |
| C | 0 | 16236 | 0 |
| D | 0 | 20083 | 0 |
| Mode M9 | |||
|---|---|---|---|
| Quadrant | BADHDUFLAG | Total packets | Discarded packets |
| A | 0 | 19 | 0 |
| B | 0 | 19 | 0 |
| C | 0 | 19 | 0 |
| D | 0 | 19 | 0 |
| Mode SS | |||
|---|---|---|---|
| Quadrant | BADHDUFLAG | Total packets | Discarded packets |
| A | 0 | 82 | 0 |
| B | 0 | 82 | 0 |
| C | 0 | 82 | 0 |
| D | 0 | 82 | 0 |
| Quadrant | Total seconds | Saturated seconds | Saturation percentage |
|---|---|---|---|
| A | 4025 | 487 | 12.099379% |
| B | 4025 | 316 | 7.850932% |
| C | 4025 | 24 | 0.596273% |
| D | 4025 | 135 | 3.354037% |
Noise dominated data is calculated using 1-second bins in cleaned event files. If a bin has >2000 counts, and if more than 50% of those come from <1% of pixels, then it is considered to be noise-dominated and hence unusable.
| Quadrant | # 1 sec bins | Bins with >0 counts | Bins with >2000 counts | High rate bins dominated by noise | Noise dominated (total time) | Noise dominated (detector-on time) | Marked lightcurve |
|---|---|---|---|---|---|---|---|
| A | 4024 | 4024 | 385 | 385 | 9.57% | 9.57% |  |
| B | 4024 | 4024 | 94 | 94 | 2.34% | 2.34% |  |
| C | 4024 | 4024 | 0 | 0 | 0.00% | 0.00% | 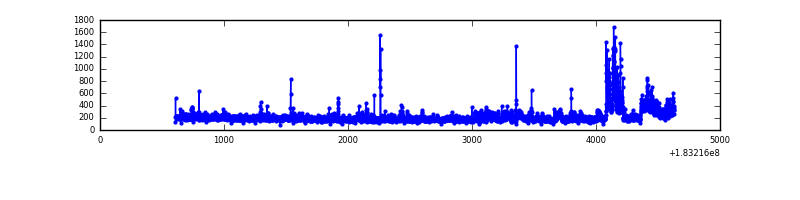 |
| D | 4024 | 4024 | 27 | 27 | 0.67% | 0.67% |  |
Top three noisy pixels from each quadrant. If the there are fewer than three noisy pixels in the level2.evt file, extra rows are filled as -1
| Pixel properties | Quadrant properties | ||||||
|---|---|---|---|---|---|---|---|
| Quadrant | DetID | PixID | Counts | Sigma | Mean | Median | Sigma |
| A | 15 | 216 | 3273573 | 86239.46 | 172 | 168 | 38.0 |
| A | 0 | 69 | 340424 | 8964.21 | 172 | 168 | 38.0 |
| A | 0 | 238 | 88807 | 2335.24 | 172 | 168 | 38.0 |
| B | 2 | 2 | 729945 | 21876.53 | 177 | 173 | 33.4 |
| B | 0 | 234 | 79598 | 2380.94 | 177 | 173 | 33.4 |
| B | 7 | 220 | 74407 | 2225.33 | 177 | 173 | 33.4 |
| C | 4 | 253 | 110623 | 2741.78 | 178 | 175 | 40.3 |
| C | 1 | 1 | 40756 | 1007.39 | 178 | 175 | 40.3 |
| C | 3 | 159 | 8911 | 216.86 | 178 | 175 | 40.3 |
| D | 7 | 85 | 738831 | 17857.19 | 174 | 170 | 41.4 |
| D | 2 | 152 | 182110 | 4398.42 | 174 | 170 | 41.4 |
| D | 14 | 52 | 69069 | 1665.64 | 174 | 170 | 41.4 |
Histogram calculated using DETX and DETY for each event in the final _common_clean file
| Quadrant A |  |
 |
Quadrant B |
|---|---|---|---|
| Quadrant D |  |
 |
Quadrant C |
| Plot type | Count rate plots | Images |
|---|---|---|
| Comparison with Poisson distribution Blue bars denote a histogram of data divided into 1 sec bins. Red curve is a Poisson curve with rate = median count rate of data. |
 |
 |
| Quadrant-wise count rates Data is divided into 100 sec bins |
 |
|
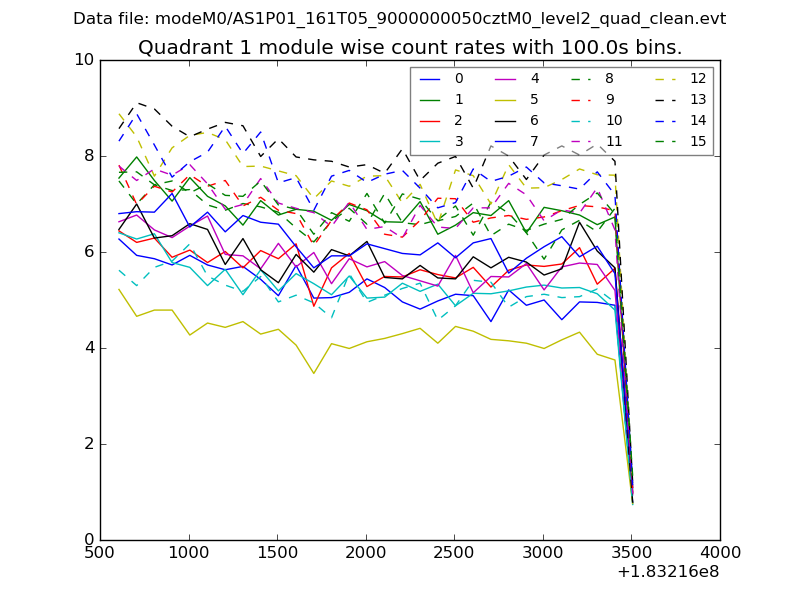
| Module-wise count rates for Quadrant A Data is divided into 100 sec bins |
 |
 |
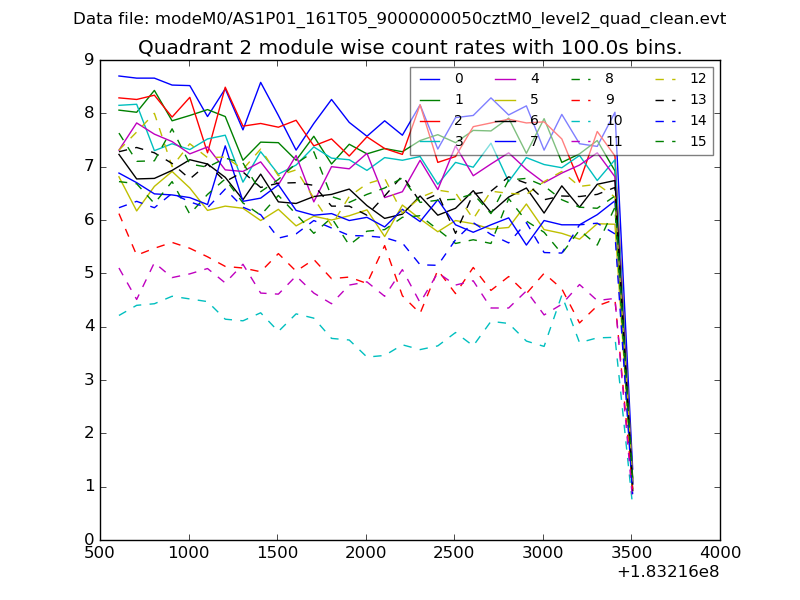
| Module-wise count rates for Quadrant B Data is divided into 100 sec bins |
 |
 |
| Module-wise count rates for Quadrant C Data is divided into 100 sec bins |
 |
 |
| Module-wise count rates for Quadrant D Data is divided into 100 sec bins |
 |
 |
| Parameter | Plot |
|---|---|
| CZT HV Monitor | 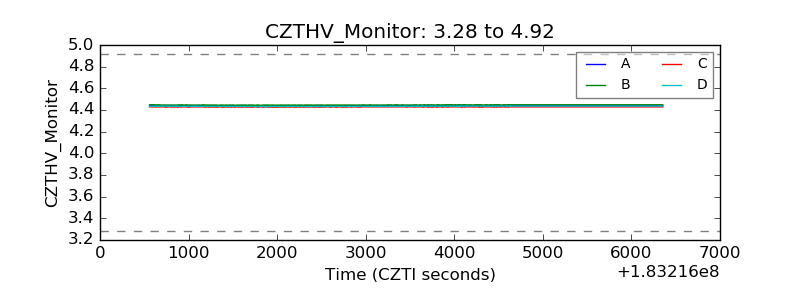 |
| D_VDD |  |
| Temperature 1 |  |
| Veto HV Monitor |  |
| Veto LLD |  |
| Alpha Counter |  |
| _CPM_Rate |  |
| CZT Counter |  |
| +2.5 Volts monitor |  |
| +5 Volts monitor | 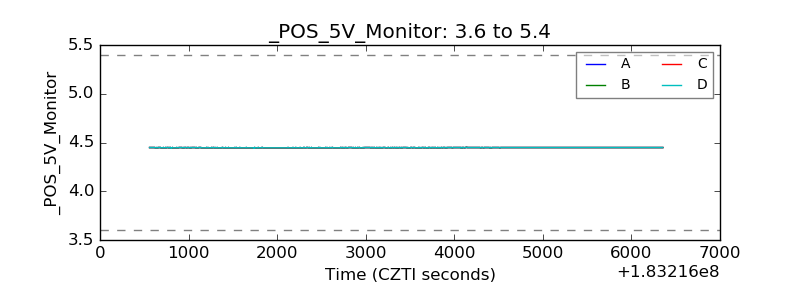 |
| _ROLL_ROT |  |
| _Roll_DEC |  |
| _Roll_RA |  |
| Veto Counter |  |