| Param | Original file | Final file |
|---|---|---|
| Filename | modeM0/AS1P01_161T01_9000000048cztM0_level2_bc.evt | modeM0/AS1P01_161T01_9000000048cztM0_level2_quad_clean.evt |
| Size (bytes) | 1,012,662,720 | 143,141,760 |
| Size | 965.8 MB | 136.5 MB |
| Events in quadrant A | 7,421,706 | 779,887 |
| Events in quadrant B | 11,959,490 | 717,351 |
| Events in quadrant C | 3,527,640 | 796,644 |
| Events in quadrant D | 6,494,380 | 764,502 |
| Mode M9 | |||
|---|---|---|---|
| Quadrant | BADHDUFLAG | Total packets | Discarded packets |
| A | 0 | 77 | 0 |
| B | 0 | 77 | 0 |
| C | 0 | 77 | 0 |
| D | 0 | 77 | 0 |
| Mode M0 | |||
|---|---|---|---|
| Quadrant | BADHDUFLAG | Total packets | Discarded packets |
| A | 0 | 101768 | 0 |
| B | 0 | 109791 | 0 |
| C | 0 | 76040 | 0 |
| D | 0 | 85494 | 0 |
| Mode SS | |||
|---|---|---|---|
| Quadrant | BADHDUFLAG | Total packets | Discarded packets |
| A | 0 | 380 | 0 |
| B | 0 | 380 | 0 |
| C | 0 | 380 | 0 |
| D | 0 | 380 | 0 |
| Quadrant | Total seconds | Saturated seconds | Saturation percentage |
|---|---|---|---|
| A | 18497 | 2161 | 11.682976% |
| B | 18497 | 3637 | 19.662648% |
| C | 18497 | 4 | 0.021625% |
| D | 18497 | 559 | 3.022112% |
Noise dominated data is calculated using 1-second bins in cleaned event files. If a bin has >2000 counts, and if more than 50% of those come from <1% of pixels, then it is considered to be noise-dominated and hence unusable.
| Quadrant | # 1 sec bins | Bins with >0 counts | Bins with >2000 counts | High rate bins dominated by noise | Noise dominated (total time) | Noise dominated (detector-on time) | Marked lightcurve |
|---|---|---|---|---|---|---|---|
| A | 27728 | 18498 | 138 | 138 | 0.50% | 0.75% |  |
| B | 27728 | 18498 | 559 | 559 | 2.02% | 3.02% |  |
| C | 27728 | 18498 | 0 | 0 | 0.00% | 0.00% |  |
| D | 27728 | 18476 | 98 | 98 | 0.35% | 0.53% |  |
Top three noisy pixels from each quadrant. If the there are fewer than three noisy pixels in the level2.evt file, extra rows are filled as -1
| Pixel properties | Quadrant properties | ||||||
|---|---|---|---|---|---|---|---|
| Quadrant | DetID | PixID | Counts | Sigma | Mean | Median | Sigma |
| A | 0 | 69 | 3529419 | 21550.47 | 811 | 799 | 163.7 |
| A | 0 | 238 | 319824 | 1948.39 | 811 | 799 | 163.7 |
| A | 12 | 243 | 202876 | 1234.15 | 811 | 799 | 163.7 |
| B | 2 | 2 | 8159438 | 57763.0 | 810 | 790 | 141.2 |
| B | 0 | 230 | 93897 | 659.2 | 810 | 790 | 141.2 |
| B | 4 | 82 | 59114 | 412.93 | 810 | 790 | 141.2 |
| C | 5 | 234 | 43289 | 242.62 | 847 | 837 | 175.0 |
| C | 1 | 1 | 29361 | 163.02 | 847 | 837 | 175.0 |
| C | 0 | 207 | 19871 | 108.78 | 847 | 837 | 175.0 |
| D | 2 | 152 | 432838 | 2389.15 | 831 | 813 | 180.8 |
| D | 7 | 85 | 394872 | 2179.2 | 831 | 813 | 180.8 |
| D | 13 | 7 | 328679 | 1813.14 | 831 | 813 | 180.8 |
Histogram calculated using DETX and DETY for each event in the final _common_clean file
| Quadrant A |  |
 |
Quadrant B |
|---|---|---|---|
| Quadrant D |  |
 |
Quadrant C |
| Plot type | Count rate plots | Images |
|---|---|---|
| Comparison with Poisson distribution Blue bars denote a histogram of data divided into 1 sec bins. Red curve is a Poisson curve with rate = median count rate of data. |
 |
 |
| Quadrant-wise count rates Data is divided into 100 sec bins |
 |
|
| Module-wise count rates for Quadrant A Data is divided into 100 sec bins |
 |
 |
| Module-wise count rates for Quadrant B Data is divided into 100 sec bins |
 |
 |
| Module-wise count rates for Quadrant C Data is divided into 100 sec bins |
 |
 |
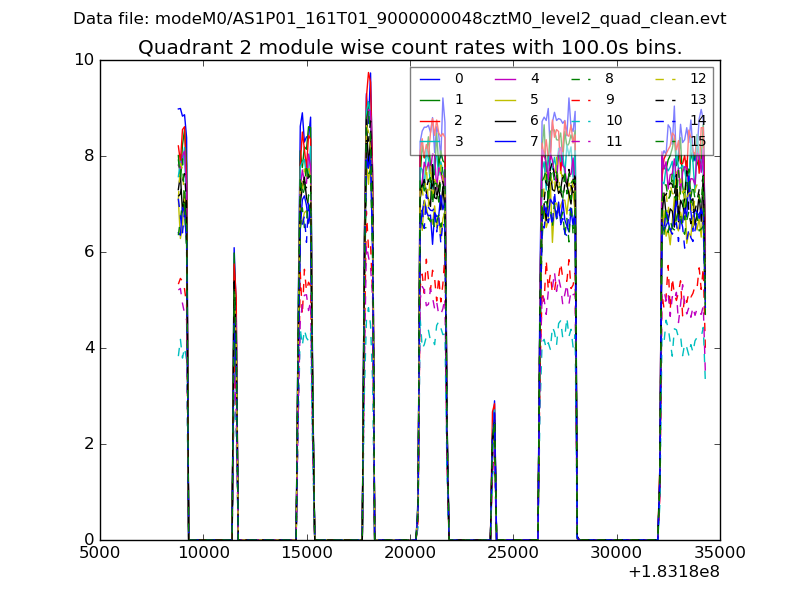
| Module-wise count rates for Quadrant D Data is divided into 100 sec bins |
 |
 |
| Parameter | Plot |
|---|---|
| CZT HV Monitor | 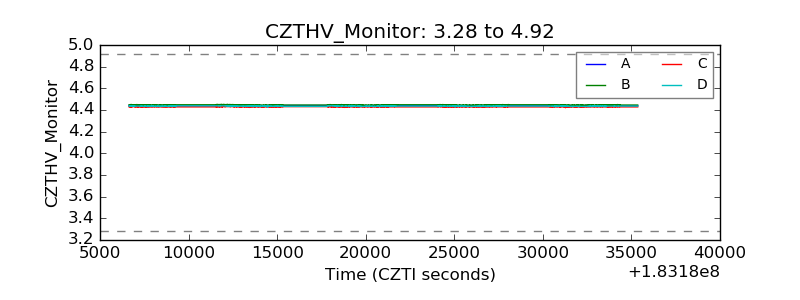 |
| D_VDD |  |
| Temperature 1 |  |
| Veto HV Monitor | 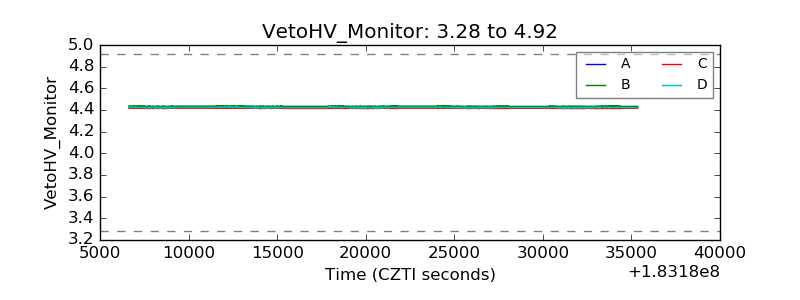 |
| Veto LLD |  |
| Alpha Counter |  |
| _CPM_Rate |  |
| CZT Counter |  |
| +2.5 Volts monitor |  |
| +5 Volts monitor | 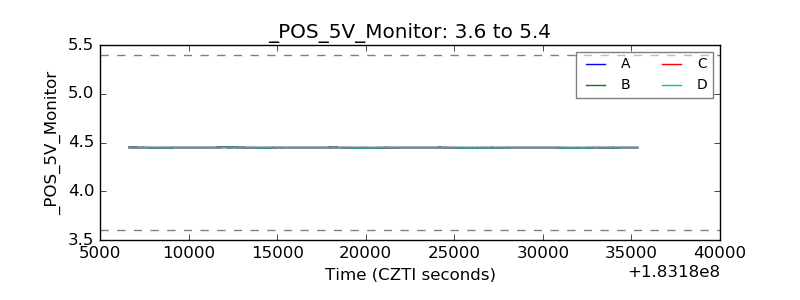 |
| Veto Counter |  |