| Param | Original file | Final file |
|---|---|---|
| Filename | modeM0/AS1P01_162T05_9000000046cztM0_level2_bc.evt | modeM0/AS1P01_162T05_9000000046cztM0_level2_quad_clean.evt |
| Size (bytes) | 1,784,165,760 | 345,623,040 |
| Size | 1.7 GB | 329.6 MB |
| Events in quadrant A | 10,662,540 | 2,122,355 |
| Events in quadrant B | 24,272,427 | 1,975,149 |
| Events in quadrant C | 6,582,503 | 2,143,566 |
| Events in quadrant D | 10,373,586 | 2,062,695 |
| Mode M9 | |||
|---|---|---|---|
| Quadrant | BADHDUFLAG | Total packets | Discarded packets |
| A | 0 | 180 | 0 |
| B | 0 | 180 | 0 |
| C | 0 | 180 | 0 |
| D | 0 | 180 | 0 |
| Mode SS | |||
|---|---|---|---|
| Quadrant | BADHDUFLAG | Total packets | Discarded packets |
| A | 0 | 644 | 0 |
| B | 0 | 644 | 0 |
| C | 0 | 644 | 0 |
| D | 0 | 644 | 0 |
| Mode M0 | |||
|---|---|---|---|
| Quadrant | BADHDUFLAG | Total packets | Discarded packets |
| A | 0 | 151074 | 0 |
| B | 0 | 194538 | 0 |
| C | 0 | 127311 | 0 |
| D | 0 | 135649 | 0 |
| Quadrant | Total seconds | Saturated seconds | Saturation percentage |
|---|---|---|---|
| A | 31449 | 1585 | 5.039906% |
| B | 31449 | 6756 | 21.482400% |
| C | 31449 | 87 | 0.276638% |
| D | 31449 | 857 | 2.725047% |
Noise dominated data is calculated using 1-second bins in cleaned event files. If a bin has >2000 counts, and if more than 50% of those come from <1% of pixels, then it is considered to be noise-dominated and hence unusable.
| Quadrant | # 1 sec bins | Bins with >0 counts | Bins with >2000 counts | High rate bins dominated by noise | Noise dominated (total time) | Noise dominated (detector-on time) | Marked lightcurve |
|---|---|---|---|---|---|---|---|
| A | 49383 | 31450 | 217 | 217 | 0.44% | 0.69% |  |
| B | 49383 | 31449 | 1495 | 1495 | 3.03% | 4.75% |  |
| C | 49383 | 31449 | 30 | 30 | 0.06% | 0.10% |  |
| D | 49383 | 31448 | 86 | 86 | 0.17% | 0.27% |  |
Top three noisy pixels from each quadrant. If the there are fewer than three noisy pixels in the level2.evt file, extra rows are filled as -1
| Pixel properties | Quadrant properties | ||||||
|---|---|---|---|---|---|---|---|
| Quadrant | DetID | PixID | Counts | Sigma | Mean | Median | Sigma |
| A | 0 | 69 | 4716772 | 17853.04 | 1260 | 1231 | 264.1 |
| A | 0 | 238 | 462444 | 1746.15 | 1260 | 1231 | 264.1 |
| A | 12 | 133 | 118168 | 442.72 | 1260 | 1231 | 264.1 |
| B | 2 | 2 | 18786173 | 82848.06 | 1229 | 1187 | 226.7 |
| B | 0 | 230 | 114674 | 500.52 | 1229 | 1187 | 226.7 |
| B | 0 | 23 | 57636 | 248.96 | 1229 | 1187 | 226.7 |
| C | 5 | 234 | 677835 | 2455.32 | 1283 | 1257 | 275.6 |
| C | 1 | 1 | 259127 | 935.82 | 1283 | 1257 | 275.6 |
| C | 3 | 159 | 233989 | 844.59 | 1283 | 1257 | 275.6 |
| D | 13 | 7 | 2003565 | 7111.16 | 1255 | 1216 | 281.6 |
| D | 2 | 25 | 887536 | 3147.68 | 1255 | 1216 | 281.6 |
| D | 7 | 85 | 498048 | 1764.45 | 1255 | 1216 | 281.6 |
Histogram calculated using DETX and DETY for each event in the final _common_clean file
| Quadrant A | 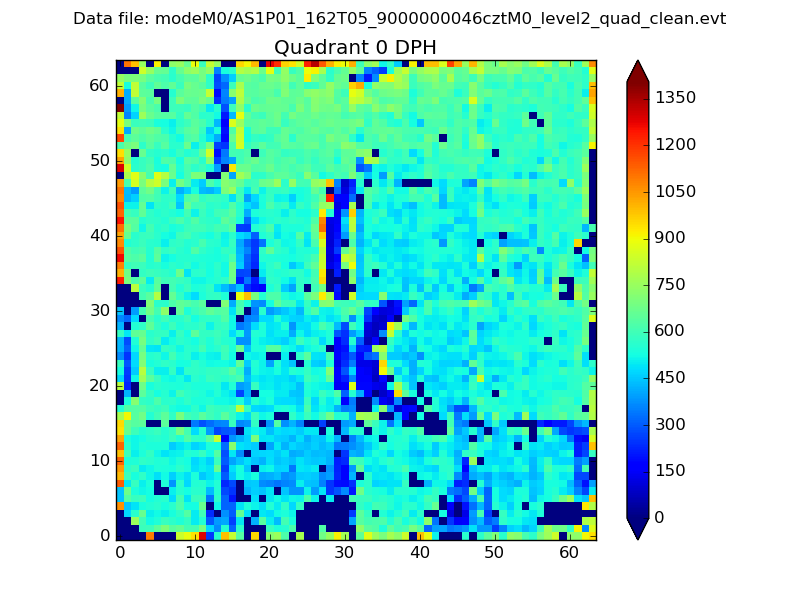 |
 |
Quadrant B |
|---|---|---|---|
| Quadrant D |  |
 |
Quadrant C |
| Plot type | Count rate plots | Images |
|---|---|---|
| Comparison with Poisson distribution Blue bars denote a histogram of data divided into 1 sec bins. Red curve is a Poisson curve with rate = median count rate of data. |
 |
 |
| Quadrant-wise count rates Data is divided into 100 sec bins |
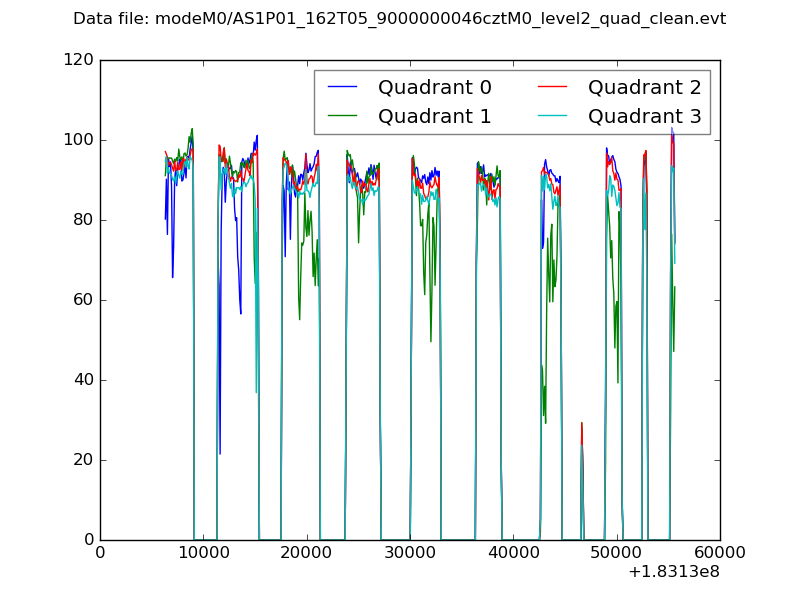 |
|
| Module-wise count rates for Quadrant A Data is divided into 100 sec bins |
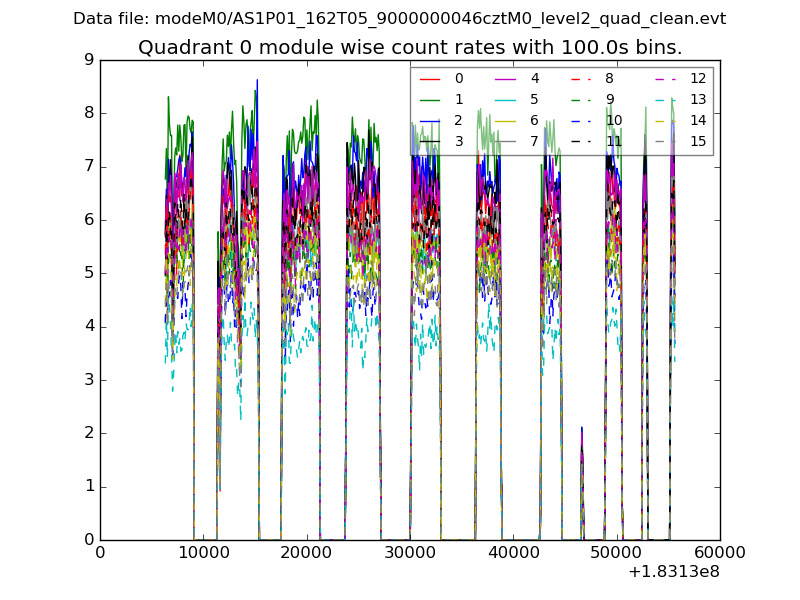 |
 |
| Module-wise count rates for Quadrant B Data is divided into 100 sec bins |
 |
 |
| Module-wise count rates for Quadrant C Data is divided into 100 sec bins |
 |
 |
| Module-wise count rates for Quadrant D Data is divided into 100 sec bins |
 |
 |
| Parameter | Plot |
|---|---|
| CZT HV Monitor |  |
| D_VDD |  |
| Temperature 1 |  |
| Veto HV Monitor | 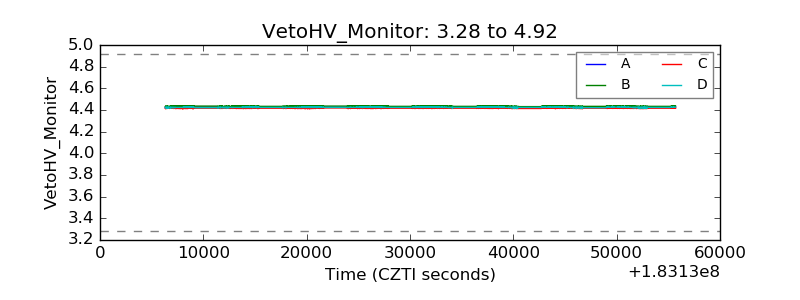 |
| Veto LLD |  |
| Alpha Counter |  |
| _CPM_Rate |  |
| CZT Counter |  |
| +2.5 Volts monitor |  |
| +5 Volts monitor |  |
| _ROLL_ROT |  |
| _Roll_DEC |  |
| _Roll_RA |  |
| Veto Counter |  |