| Param | Original file | Final file |
|---|---|---|
| Filename | modeM0/AS1P01_162T09_9000000038cztM0_level2_bc.evt | modeM0/AS1P01_162T09_9000000038cztM0_level2_quad_clean.evt |
| Size (bytes) | 596,580,480 | 242,363,520 |
| Size | 568.9 MB | 231.1 MB |
| Events in quadrant A | 3,704,565 | 1,535,190 |
| Events in quadrant B | 4,266,635 | 1,542,336 |
| Events in quadrant C | 4,043,370 | 1,500,454 |
| Events in quadrant D | 4,755,509 | 1,458,078 |
| Mode M9 | |||
|---|---|---|---|
| Quadrant | BADHDUFLAG | Total packets | Discarded packets |
| A | 0 | 115 | 0 |
| B | 0 | 115 | 0 |
| C | 0 | 115 | 0 |
| D | 0 | 115 | 0 |
| Mode M0 | |||
|---|---|---|---|
| Quadrant | BADHDUFLAG | Total packets | Discarded packets |
| A | 0 | 80114 | 0 |
| B | 0 | 80102 | 0 |
| C | 0 | 75210 | 0 |
| D | 0 | 77839 | 0 |
| Mode SS | |||
|---|---|---|---|
| Quadrant | BADHDUFLAG | Total packets | Discarded packets |
| A | 0 | 390 | 0 |
| B | 0 | 390 | 0 |
| C | 0 | 390 | 0 |
| D | 0 | 390 | 0 |
| Quadrant | Total seconds | Saturated seconds | Saturation percentage |
|---|---|---|---|
| A | 18938 | 34 | 0.179533% |
| B | 18938 | 125 | 0.660049% |
| C | 18938 | 89 | 0.469955% |
| D | 18938 | 263 | 1.388742% |
Noise dominated data is calculated using 1-second bins in cleaned event files. If a bin has >2000 counts, and if more than 50% of those come from <1% of pixels, then it is considered to be noise-dominated and hence unusable.
| Quadrant | # 1 sec bins | Bins with >0 counts | Bins with >2000 counts | High rate bins dominated by noise | Noise dominated (total time) | Noise dominated (detector-on time) | Marked lightcurve |
|---|---|---|---|---|---|---|---|
| A | 30458 | 18939 | 5 | 5 | 0.02% | 0.03% |  |
| B | 30458 | 18939 | 100 | 100 | 0.33% | 0.53% |  |
| C | 30458 | 18939 | 68 | 68 | 0.22% | 0.36% |  |
| D | 30458 | 18939 | 11 | 11 | 0.04% | 0.06% |  |
Top three noisy pixels from each quadrant. If the there are fewer than three noisy pixels in the level2.evt file, extra rows are filled as -1
| Pixel properties | Quadrant properties | ||||||
|---|---|---|---|---|---|---|---|
| Quadrant | DetID | PixID | Counts | Sigma | Mean | Median | Sigma |
| A | 14 | 235 | 145207 | 871.01 | 801 | 785 | 165.8 |
| A | 0 | 69 | 142577 | 855.15 | 801 | 785 | 165.8 |
| A | 12 | 149 | 53181 | 316.0 | 801 | 785 | 165.8 |
| B | 8 | 6 | 574111 | 3889.49 | 814 | 790 | 147.4 |
| B | 10 | 252 | 144433 | 974.49 | 814 | 790 | 147.4 |
| B | 5 | 46 | 68416 | 458.78 | 814 | 790 | 147.4 |
| C | 10 | 19 | 293094 | 1744.87 | 782 | 767 | 167.5 |
| C | 1 | 1 | 164593 | 977.86 | 782 | 767 | 167.5 |
| C | 2 | 192 | 154195 | 915.79 | 782 | 767 | 167.5 |
| D | 1 | 5 | 214430 | 1230.64 | 778 | 755 | 173.6 |
| D | 4 | 114 | 185613 | 1064.67 | 778 | 755 | 173.6 |
| D | 1 | 4 | 182558 | 1047.07 | 778 | 755 | 173.6 |
Histogram calculated using DETX and DETY for each event in the final _common_clean file
| Quadrant A | 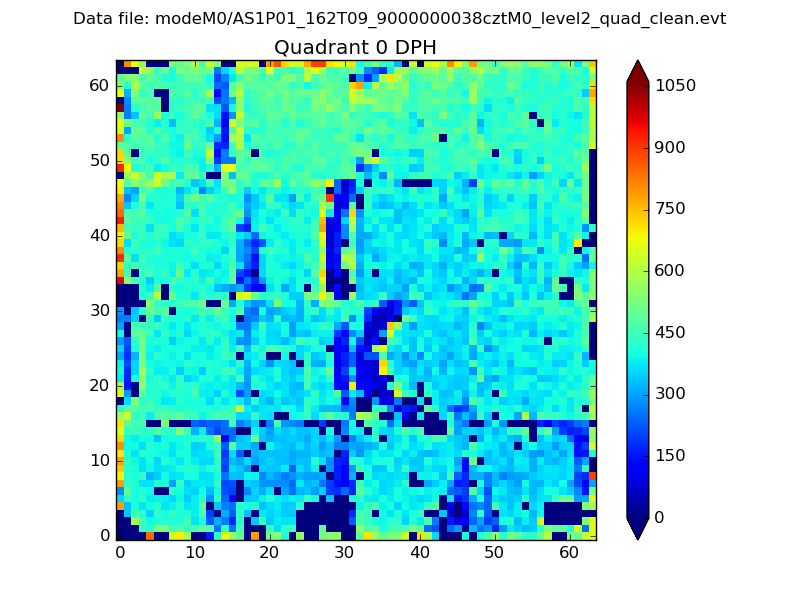 |
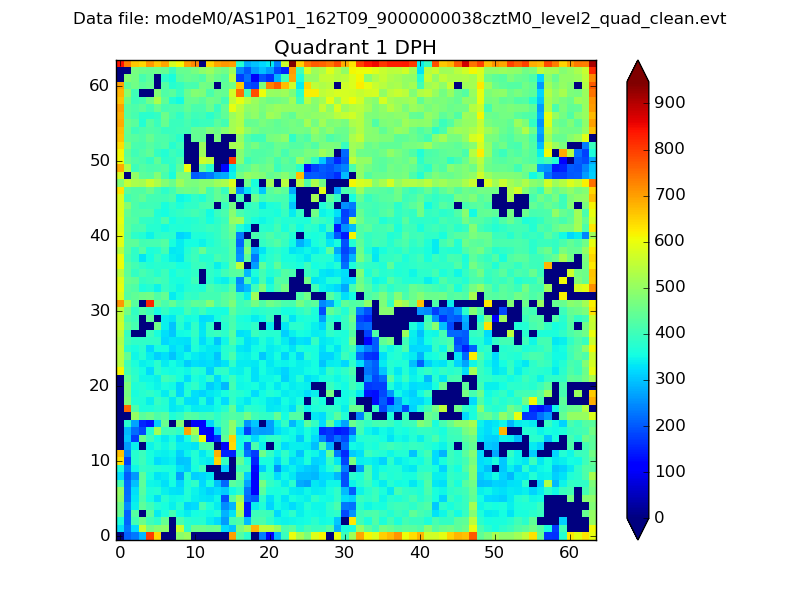 |
Quadrant B |
|---|---|---|---|
| Quadrant D | 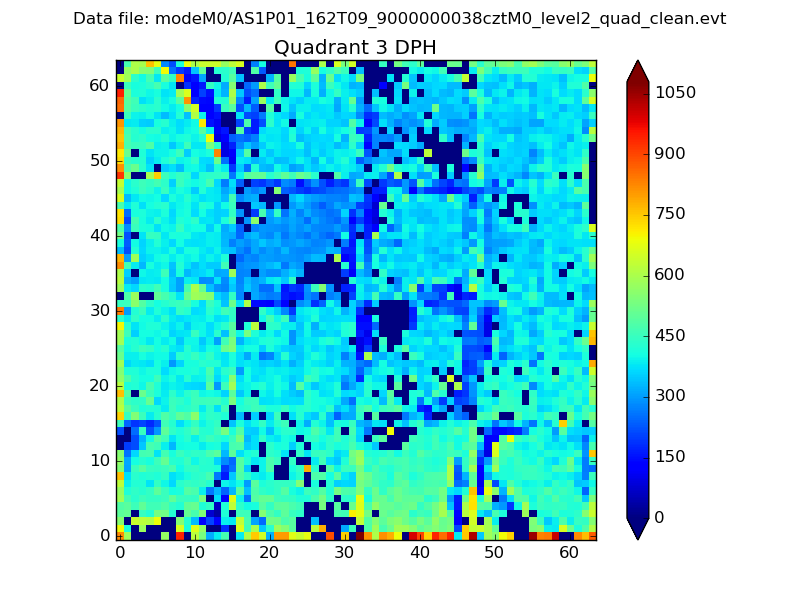 |
 |
Quadrant C |
| Plot type | Count rate plots | Images |
|---|---|---|
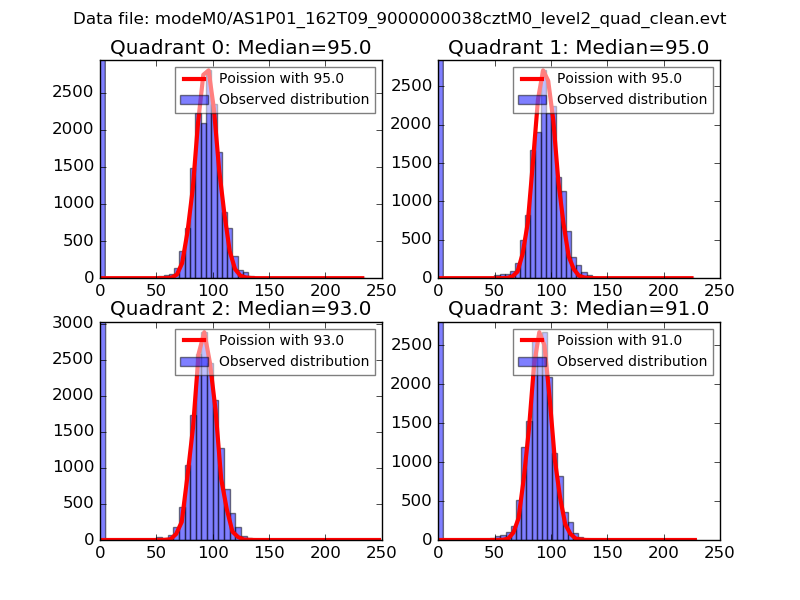
| Comparison with Poisson distribution Blue bars denote a histogram of data divided into 1 sec bins. Red curve is a Poisson curve with rate = median count rate of data. |
 |
 |
| Quadrant-wise count rates Data is divided into 100 sec bins |
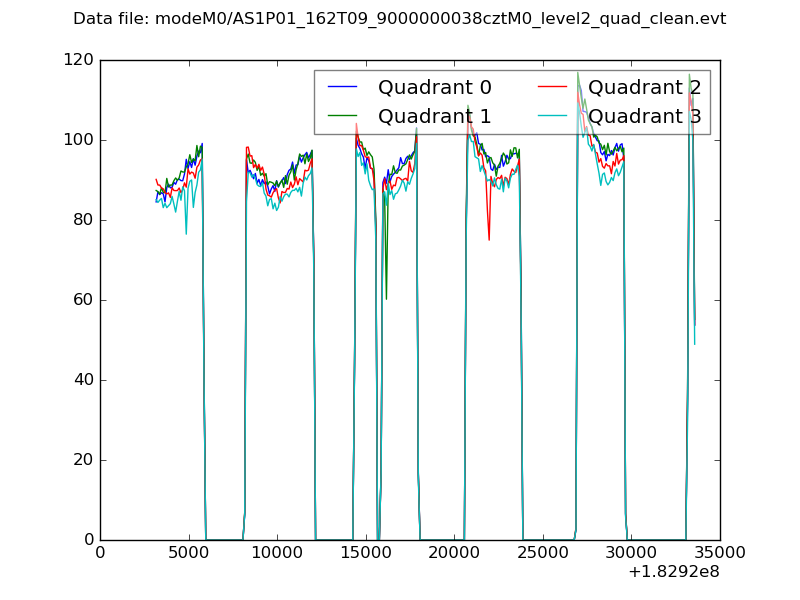 |
|
| Module-wise count rates for Quadrant A Data is divided into 100 sec bins |
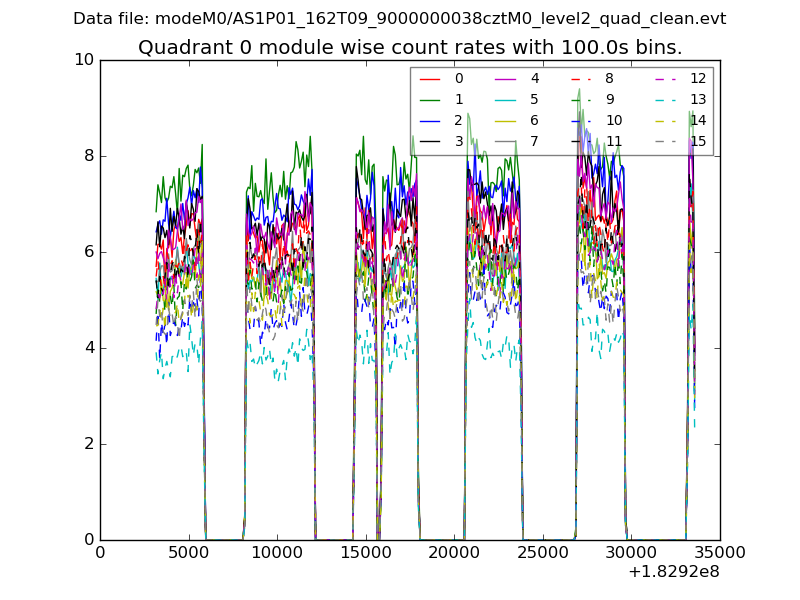 |
 |
| Module-wise count rates for Quadrant B Data is divided into 100 sec bins |
 |
 |
| Module-wise count rates for Quadrant C Data is divided into 100 sec bins |
 |
 |
| Module-wise count rates for Quadrant D Data is divided into 100 sec bins |
 |
 |
| Parameter | Plot |
|---|---|
| CZT HV Monitor |  |
| D_VDD |  |
| Temperature 1 | 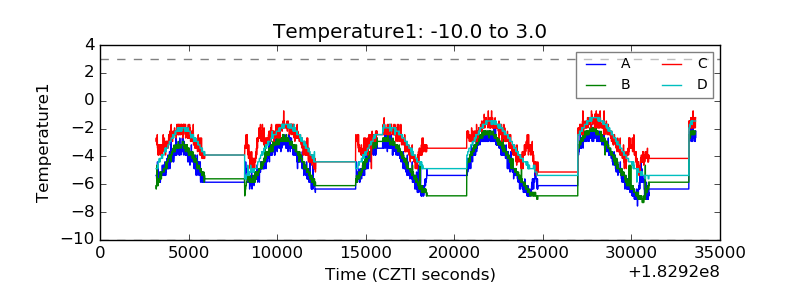 |
| Veto HV Monitor | 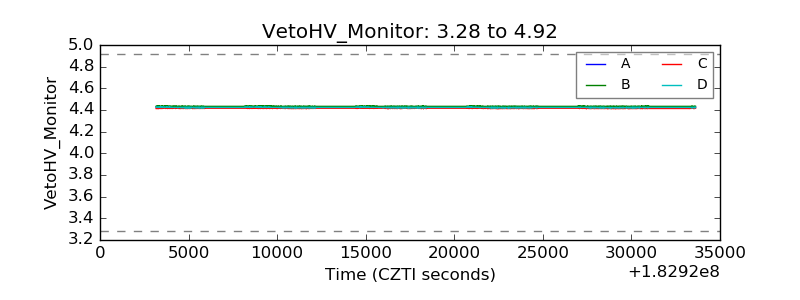 |
| Veto LLD |  |
| Alpha Counter |  |
| _CPM_Rate |  |
| CZT Counter |  |
| +2.5 Volts monitor | 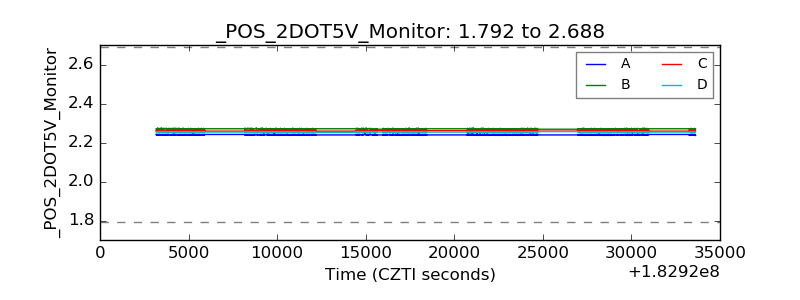 |
| +5 Volts monitor |  |
| _ROLL_ROT |  |
| _Roll_DEC |  |
| _Roll_RA |  |
| Veto Counter |  |