| Param | Original file | Final file |
|---|---|---|
| Filename | modeM0/AS1P01_161T01_9000000040cztM0_level2_bc.evt | modeM0/AS1P01_161T01_9000000040cztM0_level2_quad_clean.evt |
| Size (bytes) | 267,402,240 | 91,094,400 |
| Size | 255.0 MB | 86.9 MB |
| Events in quadrant A | 1,824,745 | 566,347 |
| Events in quadrant B | 1,702,466 | 570,337 |
| Events in quadrant C | 1,957,666 | 562,362 |
| Events in quadrant D | 2,100,945 | 543,657 |
| Mode M9 | |||
|---|---|---|---|
| Quadrant | BADHDUFLAG | Total packets | Discarded packets |
| A | 0 | 45 | 0 |
| B | 0 | 45 | 0 |
| C | 0 | 45 | 0 |
| D | 0 | 45 | 0 |
| Mode M0 | |||
|---|---|---|---|
| Quadrant | BADHDUFLAG | Total packets | Discarded packets |
| A | 0 | 32788 | 0 |
| B | 0 | 32219 | 0 |
| C | 0 | 31434 | 0 |
| D | 0 | 30837 | 0 |
| Mode SS | |||
|---|---|---|---|
| Quadrant | BADHDUFLAG | Total packets | Discarded packets |
| A | 0 | 152 | 0 |
| B | 0 | 152 | 0 |
| C | 0 | 152 | 0 |
| D | 0 | 152 | 0 |
| Quadrant | Total seconds | Saturated seconds | Saturation percentage |
|---|---|---|---|
| A | 7416 | 24 | 0.323625% |
| B | 7416 | 26 | 0.350593% |
| C | 7416 | 11 | 0.148328% |
| D | 7416 | 76 | 1.024811% |
Noise dominated data is calculated using 1-second bins in cleaned event files. If a bin has >2000 counts, and if more than 50% of those come from <1% of pixels, then it is considered to be noise-dominated and hence unusable.
| Quadrant | # 1 sec bins | Bins with >0 counts | Bins with >2000 counts | High rate bins dominated by noise | Noise dominated (total time) | Noise dominated (detector-on time) | Marked lightcurve |
|---|---|---|---|---|---|---|---|
| A | 11907 | 7416 | 0 | 0 | 0.00% | 0.00% |  |
| B | 11907 | 7416 | 0 | 0 | 0.00% | 0.00% |  |
| C | 11907 | 7416 | 2 | 2 | 0.02% | 0.03% |  |
| D | 11907 | 7415 | 2 | 2 | 0.02% | 0.03% |  |
Top three noisy pixels from each quadrant. If the there are fewer than three noisy pixels in the level2.evt file, extra rows are filled as -1
| Pixel properties | Quadrant properties | ||||||
|---|---|---|---|---|---|---|---|
| Quadrant | DetID | PixID | Counts | Sigma | Mean | Median | Sigma |
| A | 12 | 236 | 266964 | 3505.44 | 351 | 345 | 76.1 |
| A | 0 | 69 | 69371 | 907.54 | 351 | 345 | 76.1 |
| A | 15 | 250 | 39012 | 508.38 | 351 | 345 | 76.1 |
| B | 0 | 207 | 65950 | 990.82 | 360 | 351 | 66.2 |
| B | 0 | 168 | 60917 | 914.8 | 360 | 351 | 66.2 |
| B | 7 | 220 | 41332 | 618.98 | 360 | 351 | 66.2 |
| C | 1 | 1 | 443853 | 5991.66 | 347 | 343 | 74.0 |
| C | 2 | 192 | 49974 | 670.5 | 347 | 343 | 74.0 |
| C | 9 | 68 | 35725 | 478.0 | 347 | 343 | 74.0 |
| D | 1 | 5 | 173181 | 2198.94 | 343 | 335 | 78.6 |
| D | 4 | 114 | 106046 | 1344.85 | 343 | 335 | 78.6 |
| D | 10 | 154 | 83707 | 1060.65 | 343 | 335 | 78.6 |
Histogram calculated using DETX and DETY for each event in the final _common_clean file
| Quadrant A |  |
 |
Quadrant B |
|---|---|---|---|
| Quadrant D | 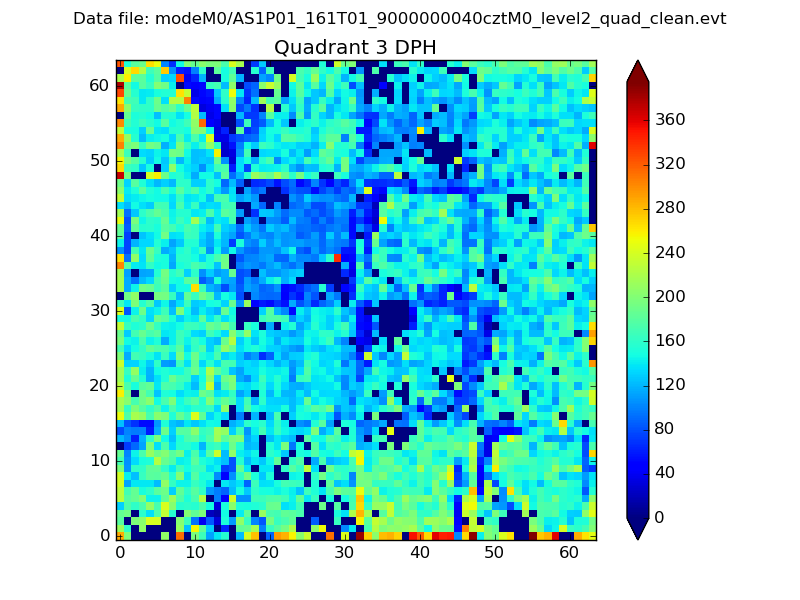 |
 |
Quadrant C |
| Plot type | Count rate plots | Images |
|---|---|---|
| Comparison with Poisson distribution Blue bars denote a histogram of data divided into 1 sec bins. Red curve is a Poisson curve with rate = median count rate of data. |
 |
 |
| Quadrant-wise count rates Data is divided into 100 sec bins |
 |
|
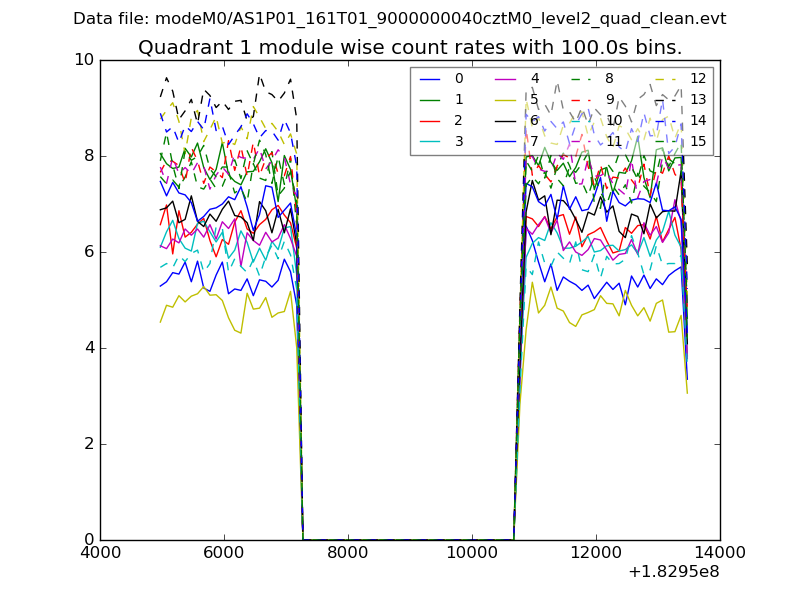
| Module-wise count rates for Quadrant A Data is divided into 100 sec bins |
 |
 |
| Module-wise count rates for Quadrant B Data is divided into 100 sec bins |
 |
 |
| Module-wise count rates for Quadrant C Data is divided into 100 sec bins |
 |
 |
| Module-wise count rates for Quadrant D Data is divided into 100 sec bins |
 |
 |
| Parameter | Plot |
|---|---|
| CZT HV Monitor |  |
| D_VDD |  |
| Temperature 1 |  |
| Veto HV Monitor |  |
| Veto LLD |  |
| Alpha Counter | 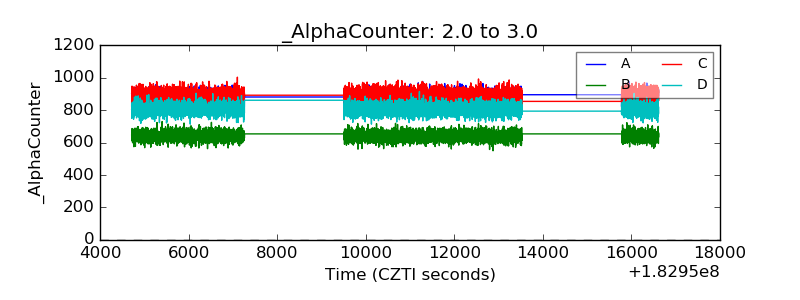 |
| _CPM_Rate |  |
| CZT Counter | 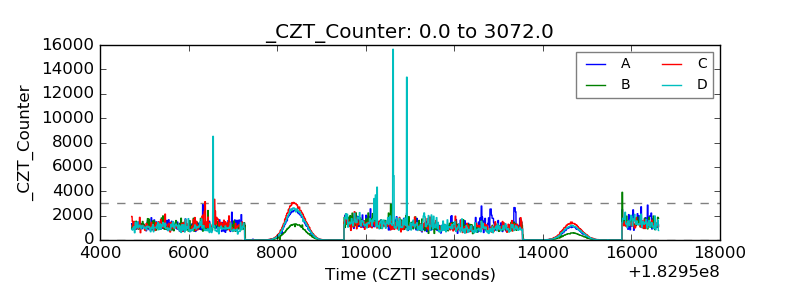 |
| +2.5 Volts monitor |  |
| +5 Volts monitor |  |
| _ROLL_ROT |  |
| _Roll_DEC |  |
| _Roll_RA | 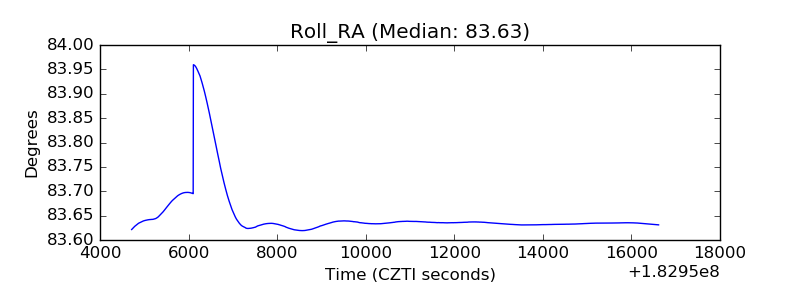 |
| Veto Counter | 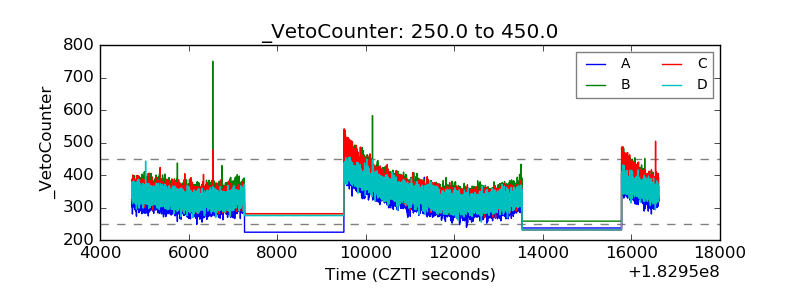 |