| Param | Original file | Final file |
|---|---|---|
| Filename | modeM0/AS1P01_126T03_9000000032cztM0_level2_bc.evt | modeM0/AS1P01_126T03_9000000032cztM0_level2_quad_clean.evt |
| Size (bytes) | 483,595,200 | 179,490,240 |
| Size | 461.2 MB | 171.2 MB |
| Events in quadrant A | 3,689,369 | 1,133,088 |
| Events in quadrant B | 3,460,545 | 1,149,226 |
| Events in quadrant C | 2,646,539 | 1,126,218 |
| Events in quadrant D | 3,911,439 | 1,083,782 |
| Mode M0 | |||
|---|---|---|---|
| Quadrant | BADHDUFLAG | Total packets | Discarded packets |
| A | 0 | 62345 | 0 |
| B | 0 | 60534 | 0 |
| C | 0 | 54080 | 0 |
| D | 0 | 57775 | 0 |
| Mode M9 | |||
|---|---|---|---|
| Quadrant | BADHDUFLAG | Total packets | Discarded packets |
| A | 0 | 52 | 0 |
| B | 0 | 52 | 0 |
| C | 0 | 52 | 0 |
| D | 0 | 52 | 0 |
| Mode SS | |||
|---|---|---|---|
| Quadrant | BADHDUFLAG | Total packets | Discarded packets |
| A | 0 | 278 | 0 |
| B | 0 | 278 | 0 |
| C | 0 | 278 | 0 |
| D | 0 | 278 | 0 |
| Quadrant | Total seconds | Saturated seconds | Saturation percentage |
|---|---|---|---|
| A | 13670 | 69 | 0.504755% |
| B | 13671 | 39 | 0.285275% |
| C | 13671 | 36 | 0.263331% |
| D | 13671 | 301 | 2.201741% |
Noise dominated data is calculated using 1-second bins in cleaned event files. If a bin has >2000 counts, and if more than 50% of those come from <1% of pixels, then it is considered to be noise-dominated and hence unusable.
| Quadrant | # 1 sec bins | Bins with >0 counts | Bins with >2000 counts | High rate bins dominated by noise | Noise dominated (total time) | Noise dominated (detector-on time) | Marked lightcurve |
|---|---|---|---|---|---|---|---|
| A | 18787 | 13671 | 23 | 23 | 0.12% | 0.17% | 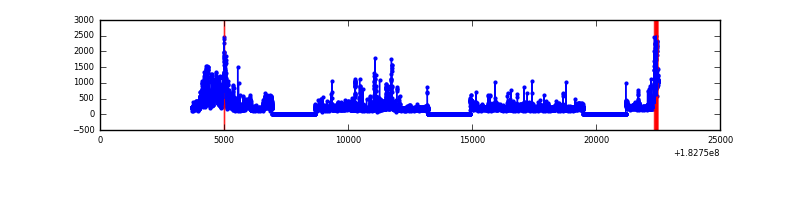 |
| B | 18787 | 13671 | 11 | 11 | 0.06% | 0.08% |  |
| C | 18787 | 13671 | 7 | 7 | 0.04% | 0.05% |  |
| D | 18787 | 13671 | 49 | 49 | 0.26% | 0.36% |  |
Top three noisy pixels from each quadrant. If the there are fewer than three noisy pixels in the level2.evt file, extra rows are filled as -1
| Pixel properties | Quadrant properties | ||||||
|---|---|---|---|---|---|---|---|
| Quadrant | DetID | PixID | Counts | Sigma | Mean | Median | Sigma |
| A | 15 | 127 | 822032 | 6609.36 | 583 | 570 | 124.3 |
| A | 15 | 66 | 165778 | 1329.24 | 583 | 570 | 124.3 |
| A | 15 | 250 | 97762 | 781.99 | 583 | 570 | 124.3 |
| B | 7 | 220 | 192888 | 1710.58 | 598 | 578 | 112.4 |
| B | 10 | 14 | 192454 | 1706.72 | 598 | 578 | 112.4 |
| B | 2 | 32 | 178264 | 1580.5 | 598 | 578 | 112.4 |
| C | 1 | 1 | 130526 | 1053.51 | 572 | 562 | 123.4 |
| C | 3 | 159 | 90101 | 725.82 | 572 | 562 | 123.4 |
| C | 10 | 19 | 62095 | 498.8 | 572 | 562 | 123.4 |
| D | 1 | 5 | 340763 | 2667.62 | 566 | 548 | 127.5 |
| D | 2 | 105 | 283017 | 2214.83 | 566 | 548 | 127.5 |
| D | 13 | 7 | 227249 | 1777.56 | 566 | 548 | 127.5 |
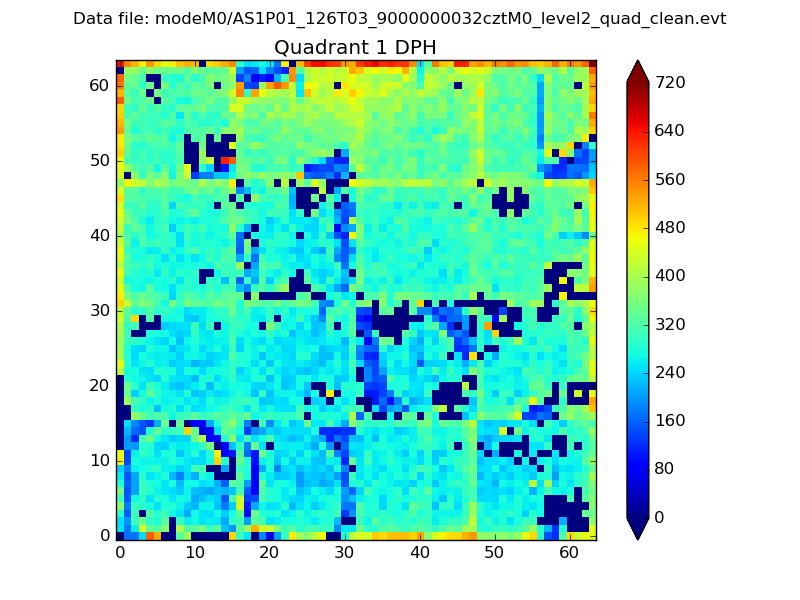
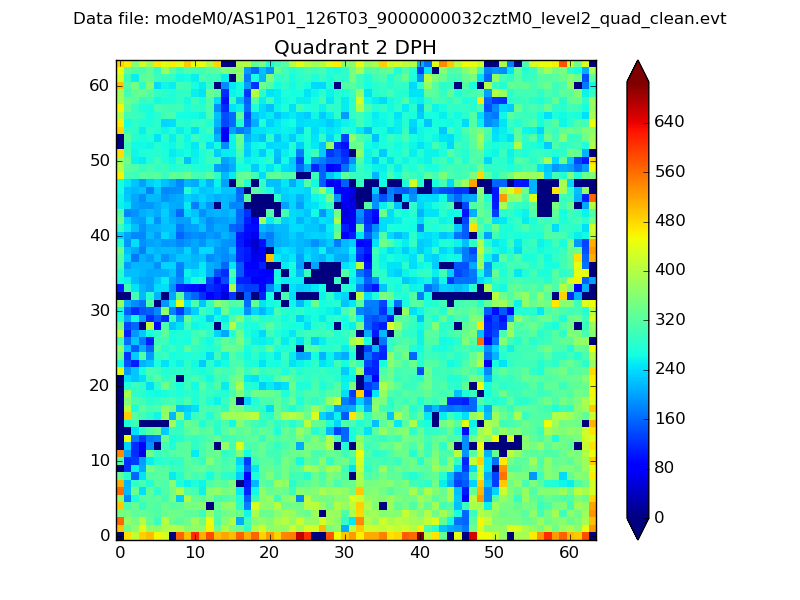
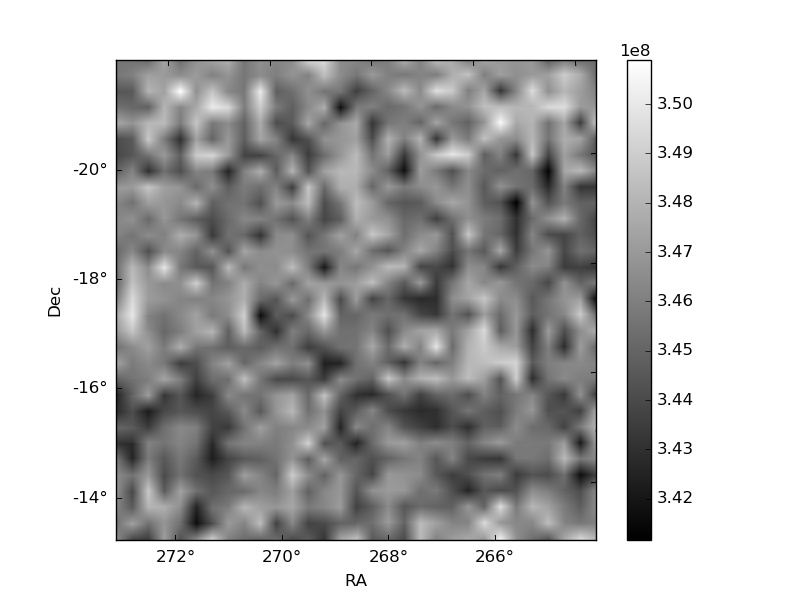
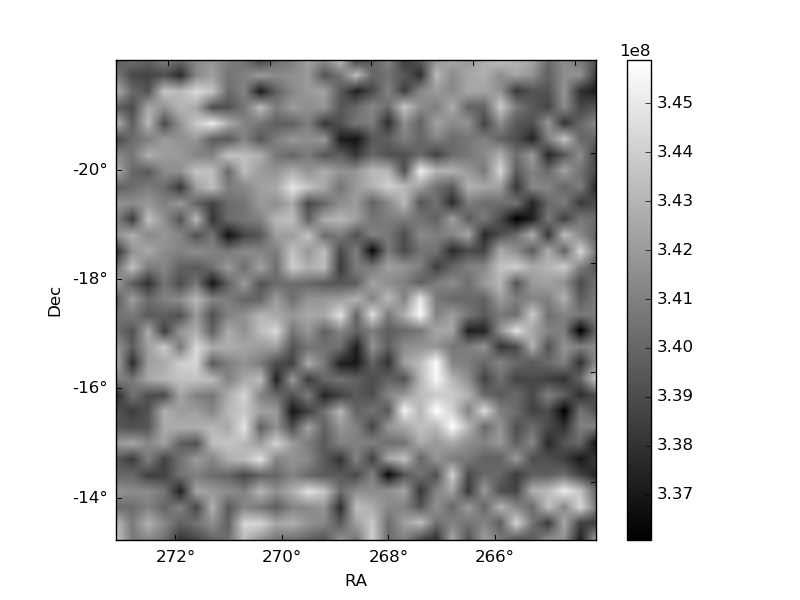
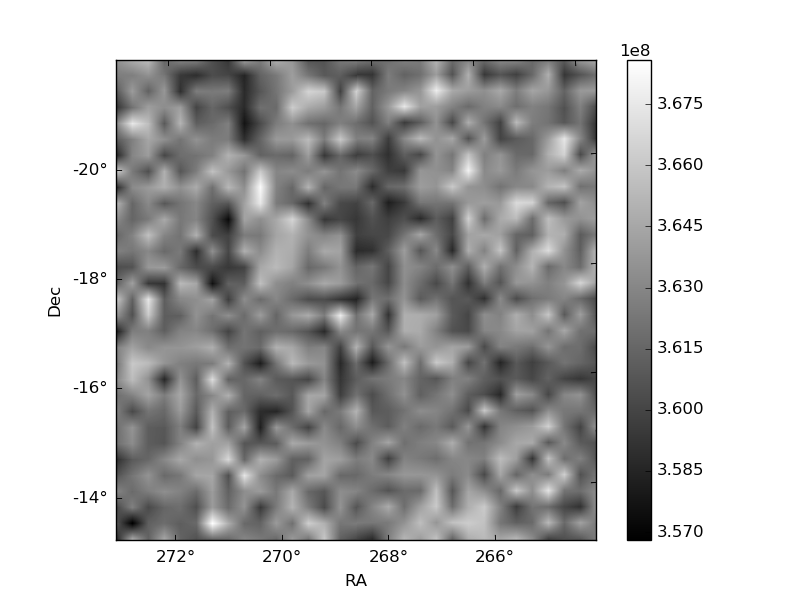
Histogram calculated using DETX and DETY for each event in the final _common_clean file
| Quadrant A |  |
 |
Quadrant B |
|---|---|---|---|
| Quadrant D |  |
 |
Quadrant C |
| Plot type | Count rate plots | Images |
|---|---|---|
| Comparison with Poisson distribution Blue bars denote a histogram of data divided into 1 sec bins. Red curve is a Poisson curve with rate = median count rate of data. |
 |
 |
| Quadrant-wise count rates Data is divided into 100 sec bins |
 |
|
| Module-wise count rates for Quadrant A Data is divided into 100 sec bins |
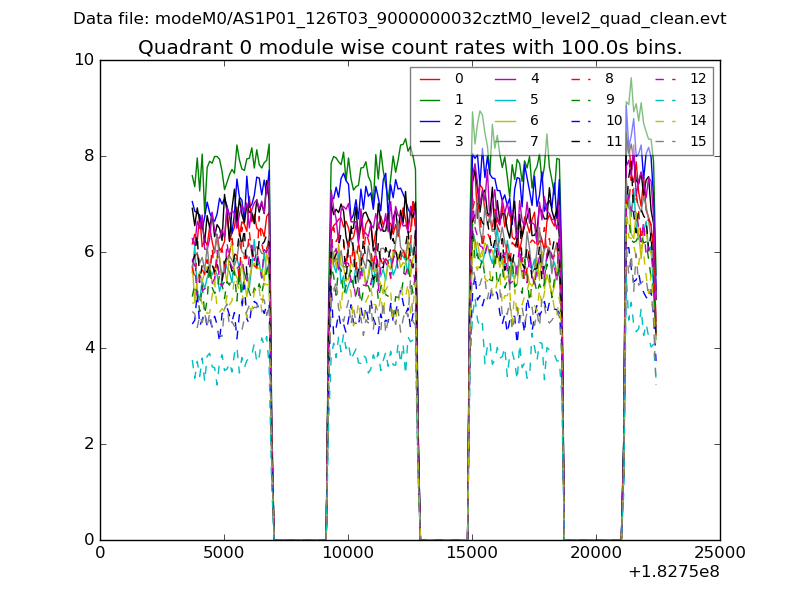 |
 |
| Module-wise count rates for Quadrant B Data is divided into 100 sec bins |
 |
 |
| Module-wise count rates for Quadrant C Data is divided into 100 sec bins |
 |
 |
| Module-wise count rates for Quadrant D Data is divided into 100 sec bins |
 |
 |
| Parameter | Plot |
|---|---|
| CZT HV Monitor | 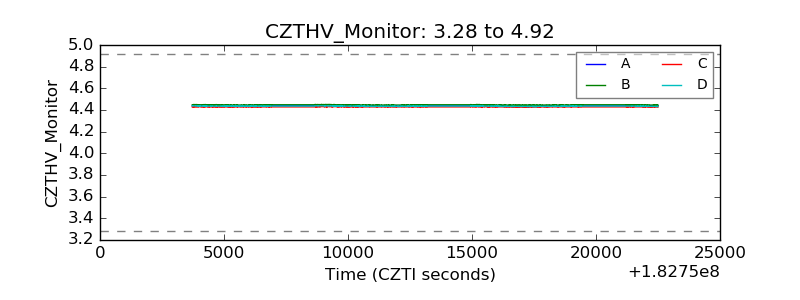 |
| D_VDD | 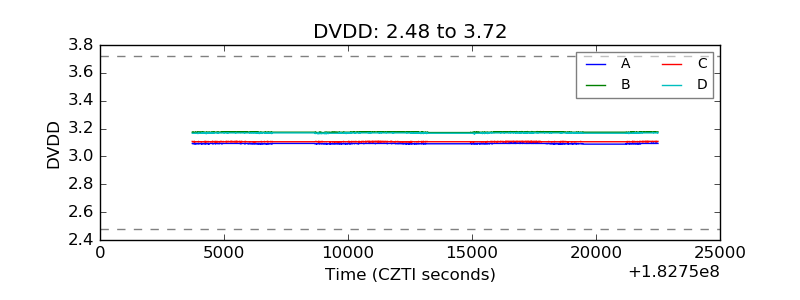 |
| Temperature 1 |  |
| Veto HV Monitor | 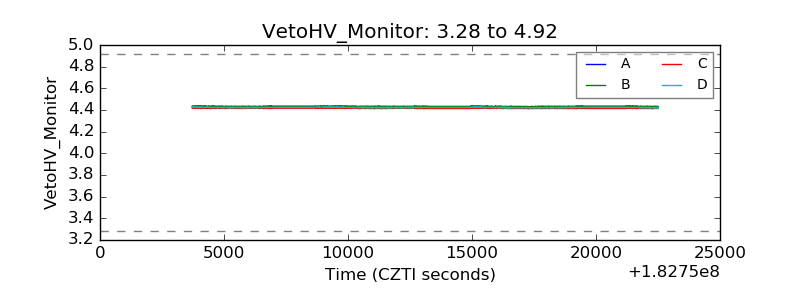 |
| Veto LLD | 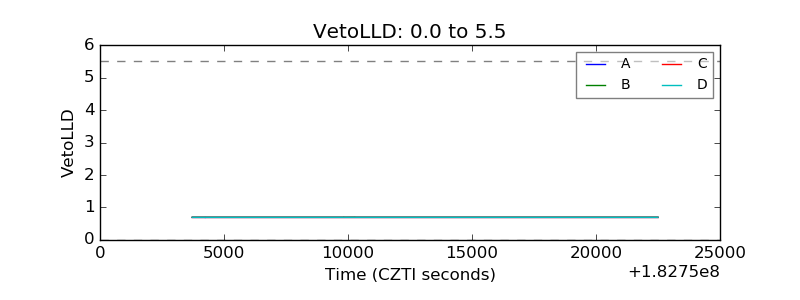 |
| Alpha Counter |  |
| _CPM_Rate | 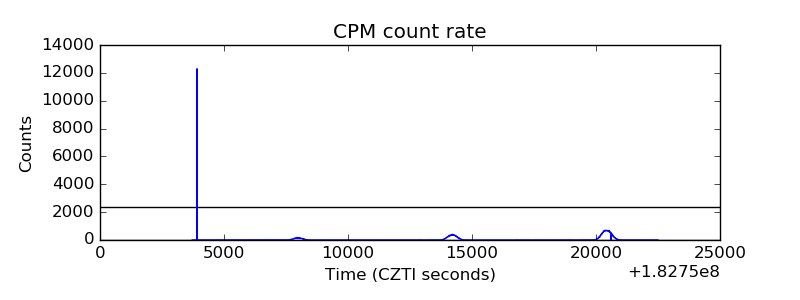 |
| CZT Counter |  |
| +2.5 Volts monitor | 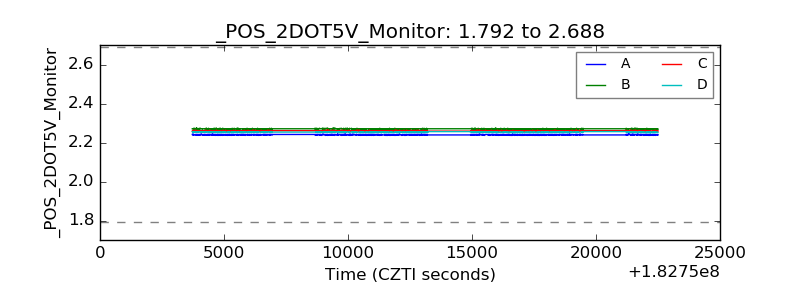 |
| +5 Volts monitor |  |
| _ROLL_ROT |  |
| _Roll_DEC |  |
| _Roll_RA |  |
| Veto Counter |  |