| Param | Original file | Final file |
|---|---|---|
| Filename | modeM0/AS1P01_126T02_9000000034cztM0_level2_bc.evt | modeM0/AS1P01_126T02_9000000034cztM0_level2_quad_clean.evt |
| Size (bytes) | 1,741,366,080 | 390,447,360 |
| Size | 1.6 GB | 372.4 MB |
| Events in quadrant A | 20,801,059 | 2,176,711 |
| Events in quadrant B | 8,962,295 | 2,237,512 |
| Events in quadrant C | 9,015,257 | 2,185,094 |
| Events in quadrant D | 10,911,950 | 2,155,013 |
| Mode M0 | |||
|---|---|---|---|
| Quadrant | BADHDUFLAG | Total packets | Discarded packets |
| A | 0 | 225541 | 0 |
| B | 0 | 188236 | 0 |
| C | 0 | 178093 | 0 |
| D | 0 | 175757 | 0 |
| Mode SS | |||
|---|---|---|---|
| Quadrant | BADHDUFLAG | Total packets | Discarded packets |
| A | 0 | 914 | 0 |
| B | 0 | 914 | 0 |
| C | 0 | 914 | 0 |
| D | 0 | 914 | 0 |
| Mode M9 | |||
|---|---|---|---|
| Quadrant | BADHDUFLAG | Total packets | Discarded packets |
| A | 0 | 171 | 0 |
| B | 0 | 171 | 0 |
| C | 0 | 171 | 0 |
| D | 0 | 171 | 0 |
| Quadrant | Total seconds | Saturated seconds | Saturation percentage |
|---|---|---|---|
| A | 44732 | 594 | 1.327908% |
| B | 44732 | 80 | 0.178843% |
| C | 44732 | 46 | 0.102835% |
| D | 44732 | 334 | 0.746669% |
Noise dominated data is calculated using 1-second bins in cleaned event files. If a bin has >2000 counts, and if more than 50% of those come from <1% of pixels, then it is considered to be noise-dominated and hence unusable.
| Quadrant | # 1 sec bins | Bins with >0 counts | Bins with >2000 counts | High rate bins dominated by noise | Noise dominated (total time) | Noise dominated (detector-on time) | Marked lightcurve |
|---|---|---|---|---|---|---|---|
| A | 61787 | 44731 | 280 | 280 | 0.45% | 0.63% |  |
| B | 61787 | 44732 | 28 | 28 | 0.05% | 0.06% |  |
| C | 61787 | 44732 | 4 | 4 | 0.01% | 0.01% |  |
| D | 61787 | 44723 | 100 | 100 | 0.16% | 0.22% |  |
Top three noisy pixels from each quadrant. If the there are fewer than three noisy pixels in the level2.evt file, extra rows are filled as -1
| Pixel properties | Quadrant properties | ||||||
|---|---|---|---|---|---|---|---|
| Quadrant | DetID | PixID | Counts | Sigma | Mean | Median | Sigma |
| A | 15 | 127 | 12162042 | 30268.97 | 1897 | 1857 | 401.7 |
| A | 12 | 149 | 706108 | 1753.01 | 1897 | 1857 | 401.7 |
| A | 0 | 6 | 123844 | 303.65 | 1897 | 1857 | 401.7 |
| B | 0 | 183 | 331250 | 941.61 | 1958 | 1896 | 349.8 |
| B | 5 | 46 | 170142 | 481.01 | 1958 | 1896 | 349.8 |
| B | 0 | 151 | 146406 | 413.15 | 1958 | 1896 | 349.8 |
| C | 1 | 1 | 534239 | 1364.47 | 1866 | 1828 | 390.2 |
| C | 5 | 234 | 333143 | 849.1 | 1866 | 1828 | 390.2 |
| C | 3 | 159 | 265023 | 674.52 | 1866 | 1828 | 390.2 |
| D | 2 | 253 | 695931 | 1703.83 | 1860 | 1804 | 407.4 |
| D | 13 | 216 | 653027 | 1598.52 | 1860 | 1804 | 407.4 |
| D | 10 | 154 | 286722 | 699.37 | 1860 | 1804 | 407.4 |
Histogram calculated using DETX and DETY for each event in the final _common_clean file
| Quadrant A |  |
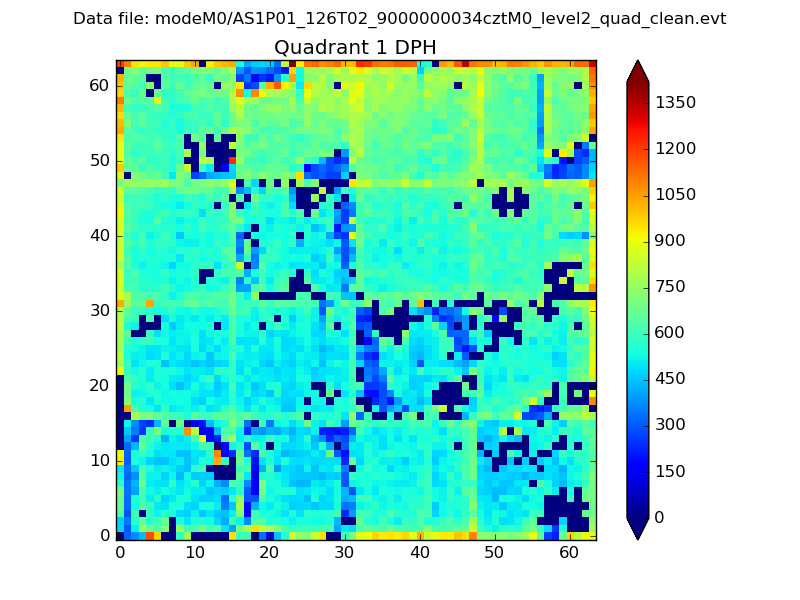 |
Quadrant B |
|---|---|---|---|
| Quadrant D |  |
 |
Quadrant C |
| Plot type | Count rate plots | Images |
|---|---|---|
| Comparison with Poisson distribution Blue bars denote a histogram of data divided into 1 sec bins. Red curve is a Poisson curve with rate = median count rate of data. |
 |
 |
| Quadrant-wise count rates Data is divided into 100 sec bins |
 |
|
| Module-wise count rates for Quadrant A Data is divided into 100 sec bins |
 |
 |
| Module-wise count rates for Quadrant B Data is divided into 100 sec bins |
 |
 |
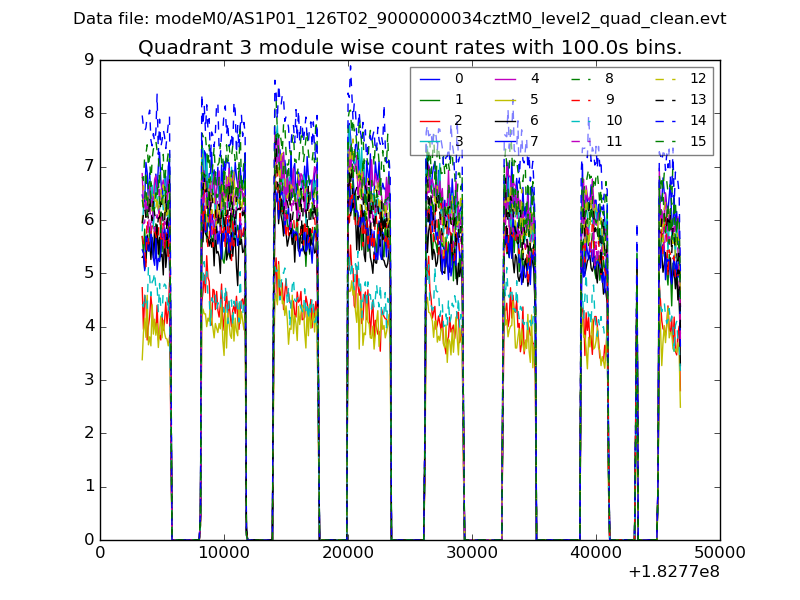
| Module-wise count rates for Quadrant C Data is divided into 100 sec bins |
 |
 |
| Module-wise count rates for Quadrant D Data is divided into 100 sec bins |
 |
 |
| Parameter | Plot |
|---|---|
| CZT HV Monitor |  |
| D_VDD | 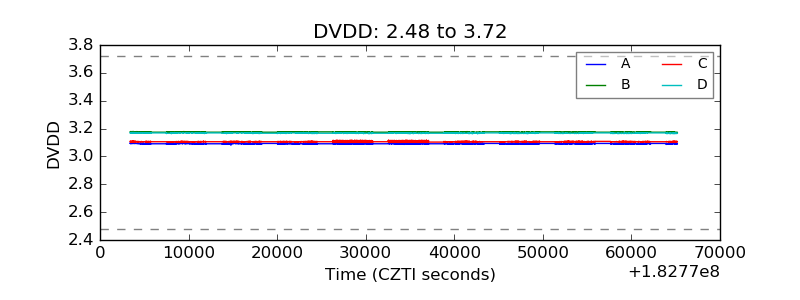 |
| Temperature 1 |  |
| Veto HV Monitor |  |
| Veto LLD |  |
| Alpha Counter |  |
| _CPM_Rate | 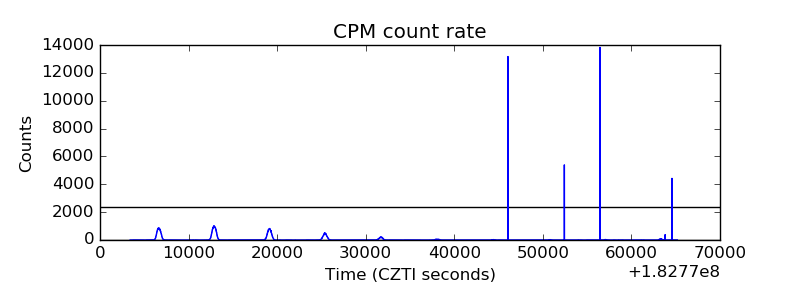 |
| CZT Counter |  |
| +2.5 Volts monitor | 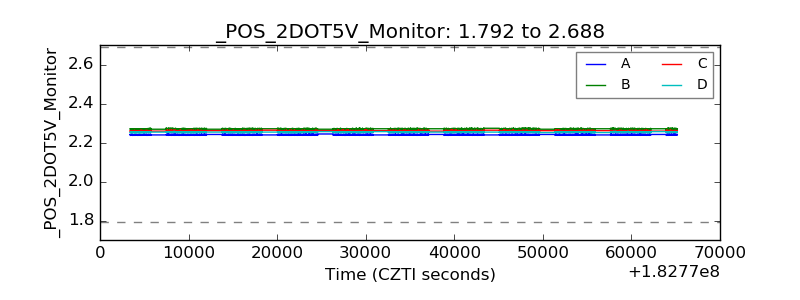 |
| +5 Volts monitor | 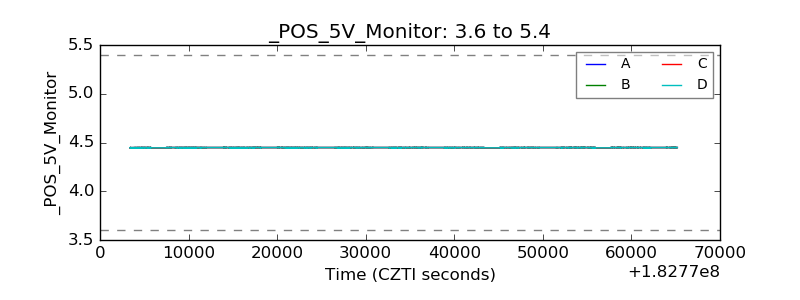 |
| _ROLL_ROT |  |
| _Roll_DEC |  |
| _Roll_RA |  |
| Veto Counter |  |