| Param | Original file | Final file |
|---|---|---|
| Filename | modeM0/AS1P01_126T01_9000000030cztM0_level2_bc.evt | modeM0/AS1P01_126T01_9000000030cztM0_level2_quad_clean.evt |
| Size (bytes) | 1,548,662,400 | 515,928,960 |
| Size | 1.4 GB | 492.0 MB |
| Events in quadrant A | 11,035,543 | 3,086,054 |
| Events in quadrant B | 9,855,256 | 3,135,148 |
| Events in quadrant C | 9,124,548 | 3,060,624 |
| Events in quadrant D | 13,509,211 | 2,948,412 |
| Mode M0 | |||
|---|---|---|---|
| Quadrant | BADHDUFLAG | Total packets | Discarded packets |
| A | 0 | 213236 | 0 |
| B | 0 | 207591 | 0 |
| C | 0 | 194881 | 0 |
| D | 0 | 201312 | 0 |
| Mode SS | |||
|---|---|---|---|
| Quadrant | BADHDUFLAG | Total packets | Discarded packets |
| A | 0 | 1008 | 0 |
| B | 0 | 1008 | 0 |
| C | 0 | 1008 | 0 |
| D | 0 | 1008 | 0 |
| Mode M9 | |||
|---|---|---|---|
| Quadrant | BADHDUFLAG | Total packets | Discarded packets |
| A | 0 | 175 | 0 |
| B | 0 | 175 | 0 |
| C | 0 | 175 | 0 |
| D | 0 | 176 | 0 |
| Quadrant | Total seconds | Saturated seconds | Saturation percentage |
|---|---|---|---|
| A | 49492 | 209 | 0.422290% |
| B | 49492 | 42 | 0.084862% |
| C | 49492 | 66 | 0.133355% |
| D | 49492 | 785 | 1.586115% |
Noise dominated data is calculated using 1-second bins in cleaned event files. If a bin has >2000 counts, and if more than 50% of those come from <1% of pixels, then it is considered to be noise-dominated and hence unusable.
| Quadrant | # 1 sec bins | Bins with >0 counts | Bins with >2000 counts | High rate bins dominated by noise | Noise dominated (total time) | Noise dominated (detector-on time) | Marked lightcurve |
|---|---|---|---|---|---|---|---|
| A | 66635 | 49491 | 100 | 100 | 0.15% | 0.20% |  |
| B | 66635 | 49491 | 7 | 7 | 0.01% | 0.01% |  |
| C | 66635 | 49491 | 21 | 21 | 0.03% | 0.04% |  |
| D | 66635 | 49491 | 44 | 44 | 0.07% | 0.09% |  |
Top three noisy pixels from each quadrant. If the there are fewer than three noisy pixels in the level2.evt file, extra rows are filled as -1
| Pixel properties | Quadrant properties | ||||||
|---|---|---|---|---|---|---|---|
| Quadrant | DetID | PixID | Counts | Sigma | Mean | Median | Sigma |
| A | 12 | 149 | 1541809 | 3530.83 | 2092 | 2047 | 436.1 |
| A | 15 | 127 | 508120 | 1160.48 | 2092 | 2047 | 436.1 |
| A | 8 | 65 | 250375 | 569.44 | 2092 | 2047 | 436.1 |
| B | 5 | 176 | 410832 | 1062.17 | 2157 | 2092 | 384.8 |
| B | 5 | 46 | 206509 | 531.21 | 2157 | 2092 | 384.8 |
| B | 0 | 157 | 137809 | 352.68 | 2157 | 2092 | 384.8 |
| C | 14 | 48 | 413623 | 939.83 | 2071 | 2031 | 437.9 |
| C | 3 | 159 | 136723 | 307.56 | 2071 | 2031 | 437.9 |
| C | 9 | 68 | 134857 | 303.29 | 2071 | 2031 | 437.9 |
| D | 13 | 7 | 1990288 | 4407.78 | 2036 | 1973 | 451.1 |
| D | 1 | 4 | 483576 | 1067.64 | 2036 | 1973 | 451.1 |
| D | 1 | 5 | 456808 | 1008.3 | 2036 | 1973 | 451.1 |
Histogram calculated using DETX and DETY for each event in the final _common_clean file
| Quadrant A | 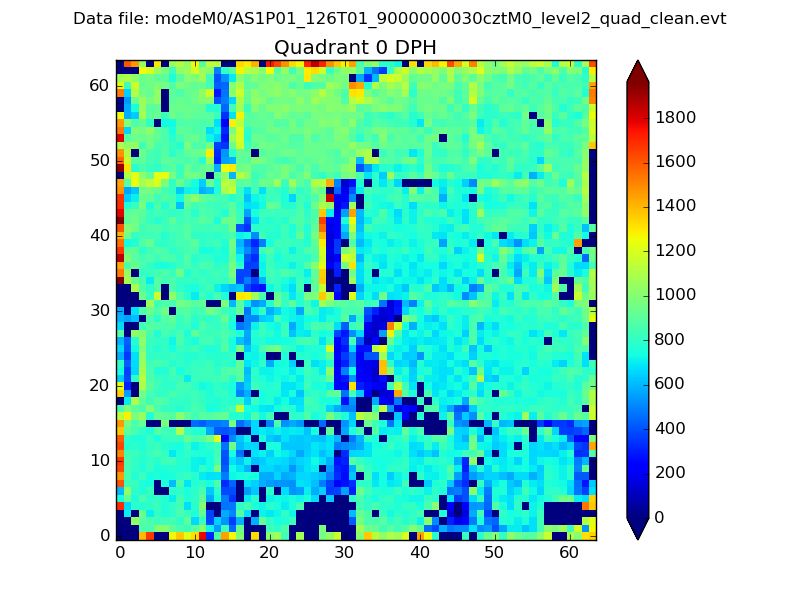 |
 |
Quadrant B |
|---|---|---|---|
| Quadrant D |  |
 |
Quadrant C |
| Plot type | Count rate plots | Images |
|---|---|---|
| Comparison with Poisson distribution Blue bars denote a histogram of data divided into 1 sec bins. Red curve is a Poisson curve with rate = median count rate of data. |
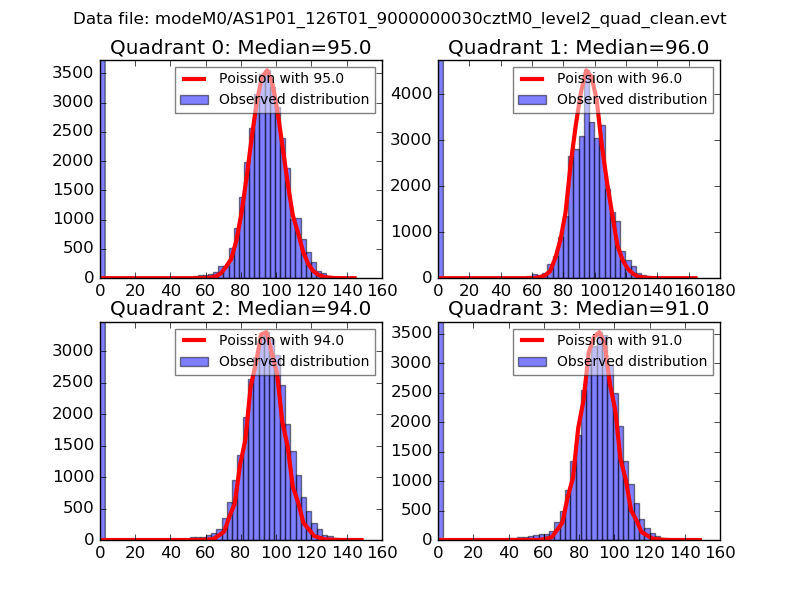 |
 |
| Quadrant-wise count rates Data is divided into 100 sec bins |
 |
|
| Module-wise count rates for Quadrant A Data is divided into 100 sec bins |
 |
 |
| Module-wise count rates for Quadrant B Data is divided into 100 sec bins |
 |
 |
| Module-wise count rates for Quadrant C Data is divided into 100 sec bins |
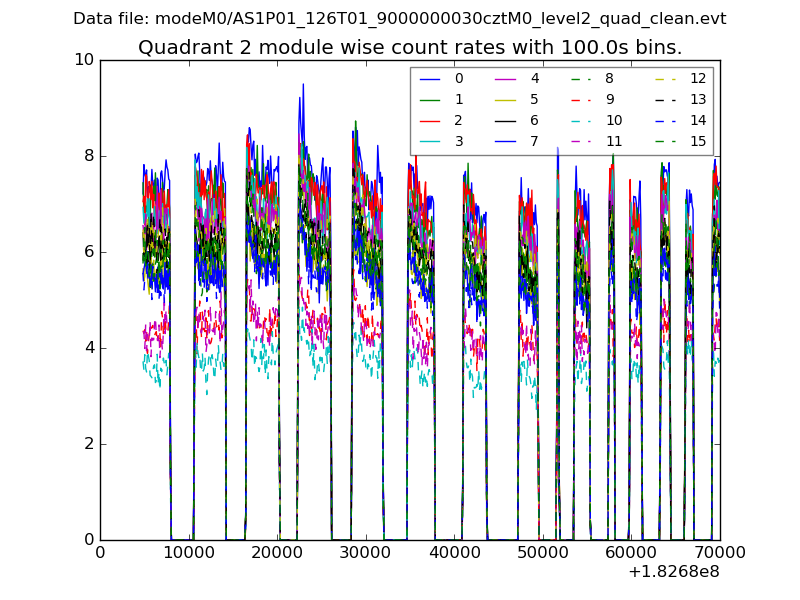 |
 |
| Module-wise count rates for Quadrant D Data is divided into 100 sec bins |
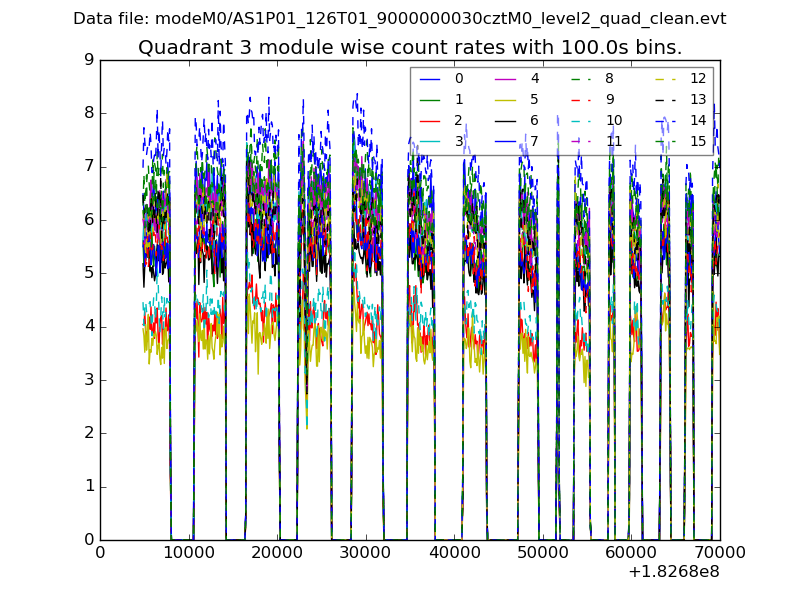 |
 |
| Parameter | Plot |
|---|---|
| CZT HV Monitor |  |
| D_VDD |  |
| Temperature 1 |  |
| Veto HV Monitor | 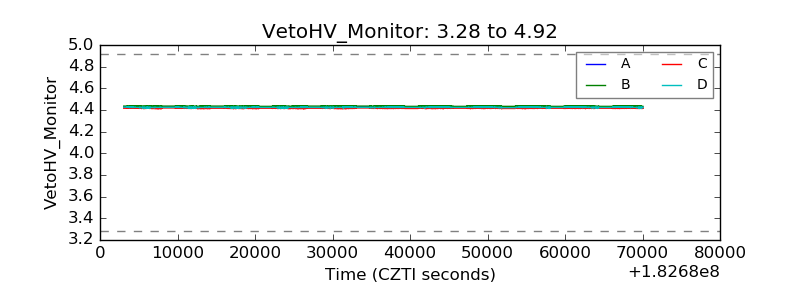 |
| Veto LLD |  |
| Alpha Counter | 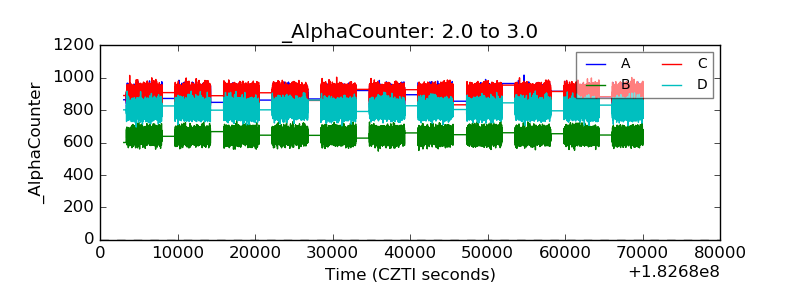 |
| _CPM_Rate |  |
| CZT Counter |  |
| +2.5 Volts monitor |  |
| +5 Volts monitor |  |
| _ROLL_ROT |  |
| _Roll_DEC |  |
| _Roll_RA | 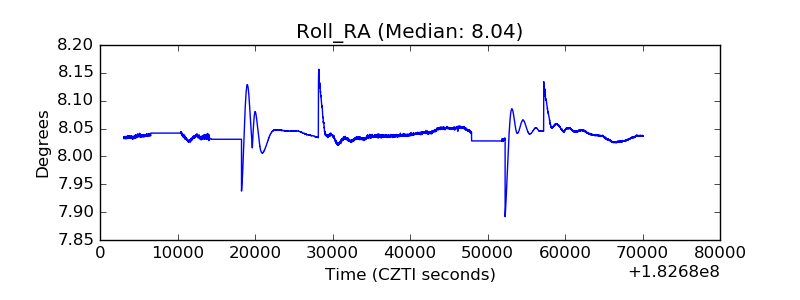 |
| Veto Counter | 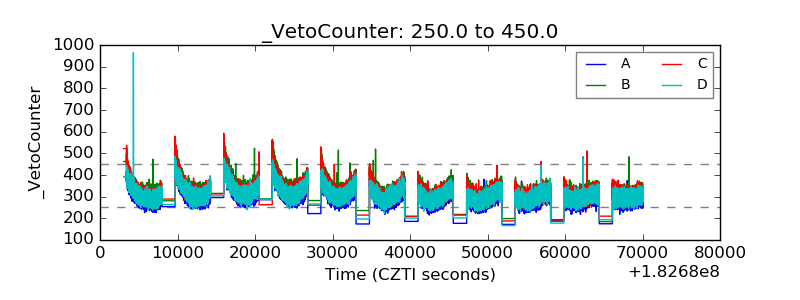 |