| Param | Original file | Final file |
|---|---|---|
| Filename | modeM0/AS1P01_122T02_9000000028cztM0_level2_bc.evt | modeM0/AS1P01_122T02_9000000028cztM0_level2_quad_clean.evt |
| Size (bytes) | 439,119,360 | 133,712,640 |
| Size | 418.8 MB | 127.5 MB |
| Events in quadrant A | 2,024,084 | 834,390 |
| Events in quadrant B | 3,308,231 | 836,840 |
| Events in quadrant C | 2,757,893 | 820,999 |
| Events in quadrant D | 4,449,247 | 792,142 |
| Mode M9 | |||
|---|---|---|---|
| Quadrant | BADHDUFLAG | Total packets | Discarded packets |
| A | 0 | 51 | 0 |
| B | 0 | 51 | 0 |
| C | 0 | 51 | 0 |
| D | 0 | 51 | 0 |
| Mode SS | |||
|---|---|---|---|
| Quadrant | BADHDUFLAG | Total packets | Discarded packets |
| A | 0 | 230 | 0 |
| B | 0 | 228 | 0 |
| C | 0 | 228 | 0 |
| D | 0 | 230 | 0 |
| Mode M0 | |||
|---|---|---|---|
| Quadrant | BADHDUFLAG | Total packets | Discarded packets |
| A | 0 | 46521 | 0 |
| B | 0 | 50673 | 0 |
| C | 0 | 46396 | 0 |
| D | 0 | 50369 | 0 |
| Quadrant | Total seconds | Saturated seconds | Saturation percentage |
|---|---|---|---|
| A | 11044 | 7 | 0.063383% |
| B | 11055 | 209 | 1.890547% |
| C | 11047 | 149 | 1.348782% |
| D | 11045 | 138 | 1.249434% |
Noise dominated data is calculated using 1-second bins in cleaned event files. If a bin has >2000 counts, and if more than 50% of those come from <1% of pixels, then it is considered to be noise-dominated and hence unusable.
| Quadrant | # 1 sec bins | Bins with >0 counts | Bins with >2000 counts | High rate bins dominated by noise | Noise dominated (total time) | Noise dominated (detector-on time) | Marked lightcurve |
|---|---|---|---|---|---|---|---|
| A | 36260 | 11061 | 0 | 0 | 0.00% | 0.00% |  |
| B | 36260 | 11067 | 57 | 57 | 0.16% | 0.52% | 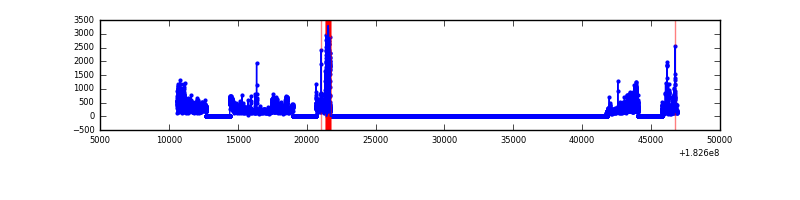 |
| C | 36260 | 11061 | 160 | 160 | 0.44% | 1.45% |  |
| D | 36260 | 11056 | 21 | 21 | 0.06% | 0.19% |  |
Top three noisy pixels from each quadrant. If the there are fewer than three noisy pixels in the level2.evt file, extra rows are filled as -1
| Pixel properties | Quadrant properties | ||||||
|---|---|---|---|---|---|---|---|
| Quadrant | DetID | PixID | Counts | Sigma | Mean | Median | Sigma |
| A | 15 | 250 | 22851 | 217.57 | 490 | 480 | 102.8 |
| A | 11 | 242 | 13572 | 127.33 | 490 | 480 | 102.8 |
| A | 12 | 149 | 13507 | 126.69 | 490 | 480 | 102.8 |
| B | 8 | 9 | 338045 | 3739.48 | 500 | 485 | 90.3 |
| B | 5 | 156 | 229979 | 2542.33 | 500 | 485 | 90.3 |
| B | 10 | 14 | 227688 | 2516.95 | 500 | 485 | 90.3 |
| C | 9 | 54 | 487303 | 4743.3 | 484 | 476 | 102.6 |
| C | 9 | 68 | 123411 | 1197.79 | 484 | 476 | 102.6 |
| C | 3 | 159 | 113800 | 1104.15 | 484 | 476 | 102.6 |
| D | 10 | 154 | 1411786 | 13099.8 | 478 | 464 | 107.7 |
| D | 1 | 4 | 575161 | 5334.3 | 478 | 464 | 107.7 |
| D | 1 | 5 | 112497 | 1039.88 | 478 | 464 | 107.7 |
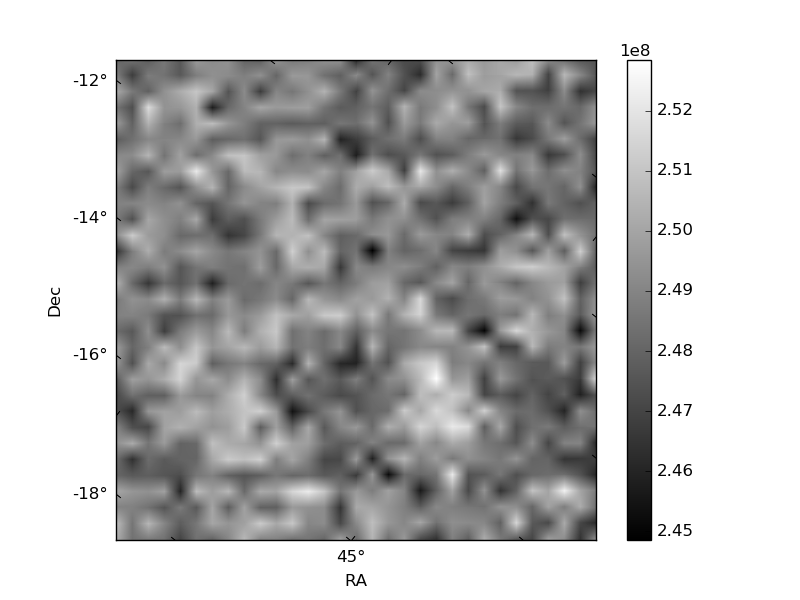
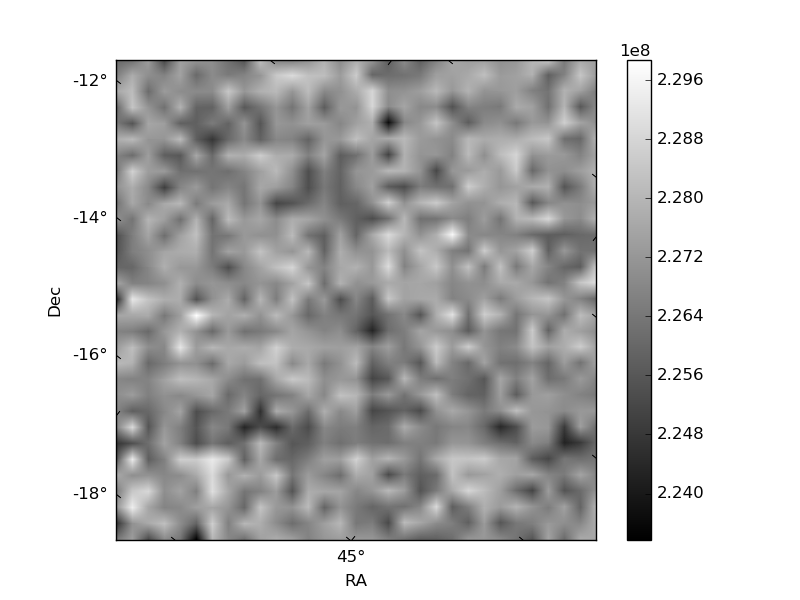
Histogram calculated using DETX and DETY for each event in the final _common_clean file
| Quadrant A |  |
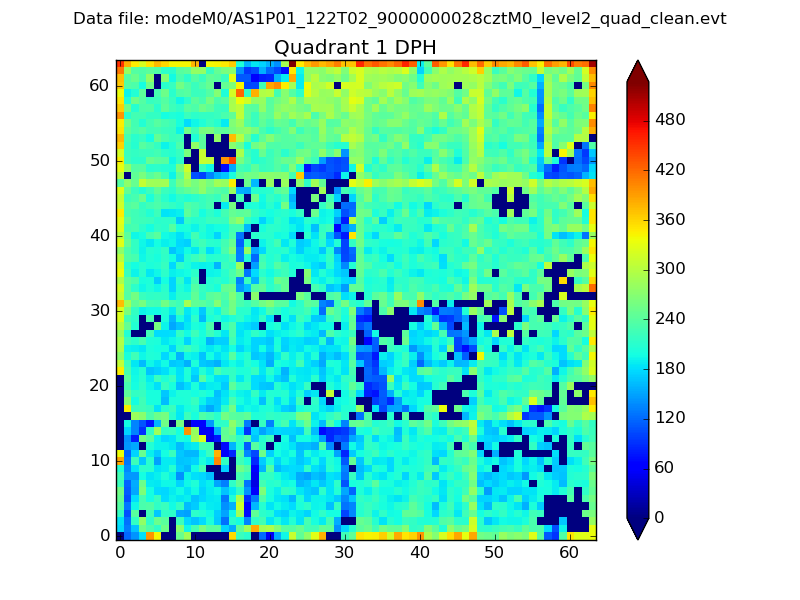 |
Quadrant B |
|---|---|---|---|
| Quadrant D |  |
 |
Quadrant C |
| Plot type | Count rate plots | Images |
|---|---|---|
| Comparison with Poisson distribution Blue bars denote a histogram of data divided into 1 sec bins. Red curve is a Poisson curve with rate = median count rate of data. |
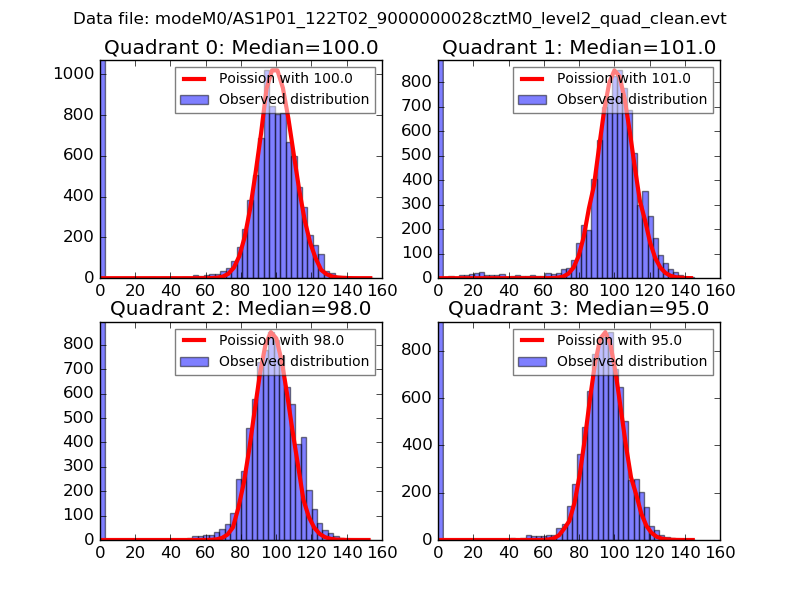 |
 |
| Quadrant-wise count rates Data is divided into 100 sec bins |
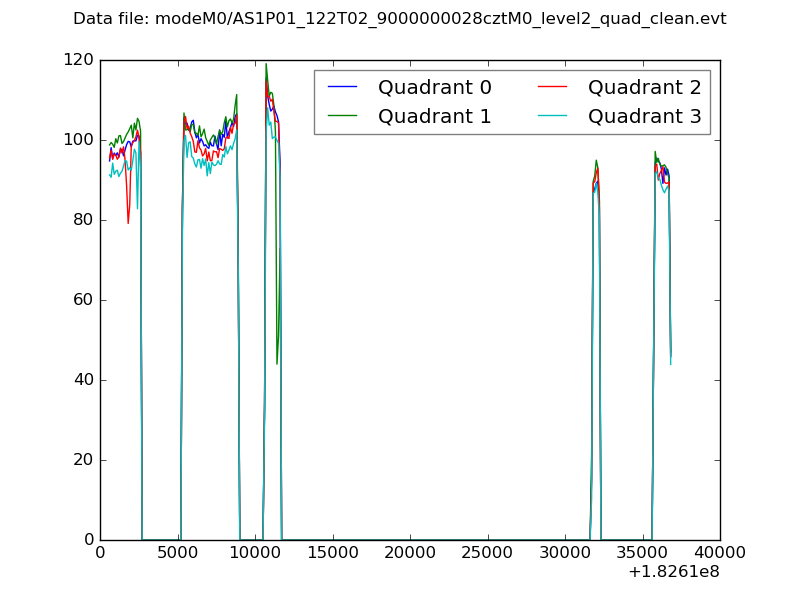 |
|
| Module-wise count rates for Quadrant A Data is divided into 100 sec bins |
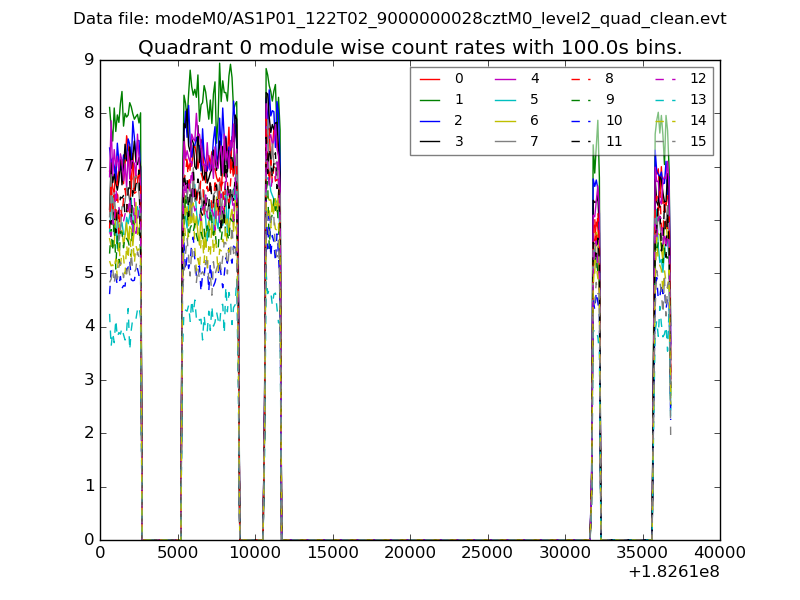 |
 |
| Module-wise count rates for Quadrant B Data is divided into 100 sec bins |
 |
 |
| Module-wise count rates for Quadrant C Data is divided into 100 sec bins |
 |
 |
| Module-wise count rates for Quadrant D Data is divided into 100 sec bins |
 |
 |
| Parameter | Plot |
|---|---|
| CZT HV Monitor | 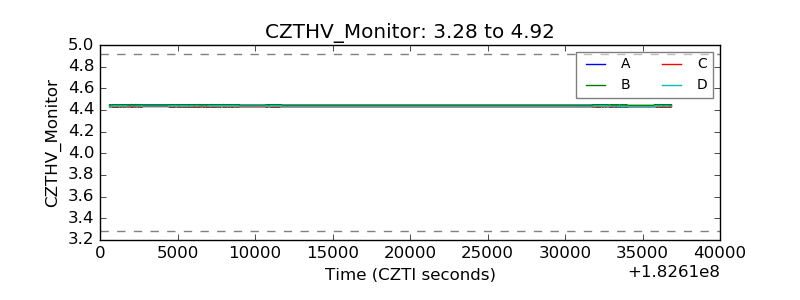 |
| D_VDD |  |
| Temperature 1 |  |
| Veto HV Monitor |  |
| Veto LLD |  |
| Alpha Counter |  |
| _CPM_Rate |  |
| CZT Counter |  |
| +2.5 Volts monitor | 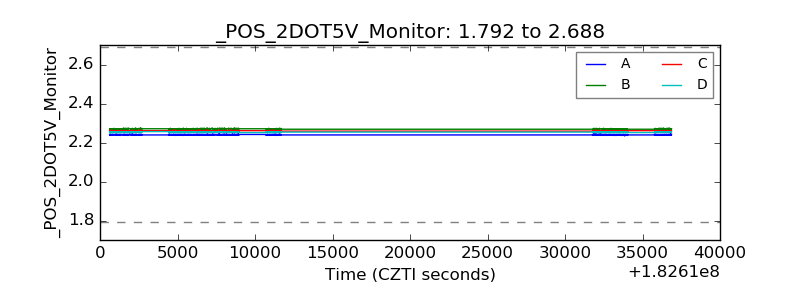 |
| +5 Volts monitor |  |
| _ROLL_ROT |  |
| _Roll_DEC |  |
| _Roll_RA | 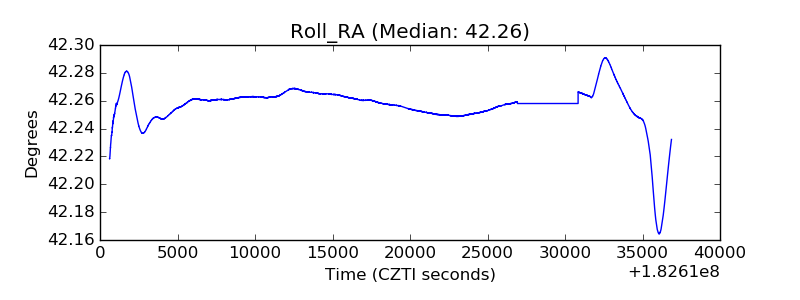 |
| Veto Counter |  |