| Param | Original file | Final file |
|---|---|---|
| Filename | modeM0/AS1P01_140T01_9000000018cztM0_level2_bc.evt | modeM0/AS1P01_140T01_9000000018cztM0_level2_quad_clean.evt |
| Size (bytes) | 2,109,919,680 | 667,039,680 |
| Size | 2.0 GB | 636.1 MB |
| Events in quadrant A | 14,338,373 | 4,029,164 |
| Events in quadrant B | 14,344,123 | 4,037,857 |
| Events in quadrant C | 11,631,306 | 4,033,647 |
| Events in quadrant D | 19,365,200 | 3,856,459 |
| Mode SS | |||
|---|---|---|---|
| Quadrant | BADHDUFLAG | Total packets | Discarded packets |
| A | 0 | 1266 | 0 |
| B | 0 | 1266 | 0 |
| C | 0 | 1268 | 0 |
| D | 0 | 1266 | 0 |
| Mode M9 | |||
|---|---|---|---|
| Quadrant | BADHDUFLAG | Total packets | Discarded packets |
| A | 0 | 214 | 0 |
| B | 0 | 214 | 0 |
| C | 0 | 214 | 0 |
| D | 0 | 215 | 0 |
| Mode M0 | |||
|---|---|---|---|
| Quadrant | BADHDUFLAG | Total packets | Discarded packets |
| A | 0 | 270547 | 0 |
| B | 0 | 268057 | 0 |
| C | 0 | 245475 | 0 |
| D | 0 | 265675 | 0 |
| Quadrant | Total seconds | Saturated seconds | Saturation percentage |
|---|---|---|---|
| A | 61938 | 985 | 1.590300% |
| B | 61900 | 1132 | 1.828756% |
| C | 61817 | 44 | 0.071178% |
| D | 61896 | 1181 | 1.908039% |
Noise dominated data is calculated using 1-second bins in cleaned event files. If a bin has >2000 counts, and if more than 50% of those come from <1% of pixels, then it is considered to be noise-dominated and hence unusable.
| Quadrant | # 1 sec bins | Bins with >0 counts | Bins with >2000 counts | High rate bins dominated by noise | Noise dominated (total time) | Noise dominated (detector-on time) | Marked lightcurve |
|---|---|---|---|---|---|---|---|
| A | 83684 | 61965 | 449 | 449 | 0.54% | 0.72% |  |
| B | 83684 | 61930 | 631 | 631 | 0.75% | 1.02% | 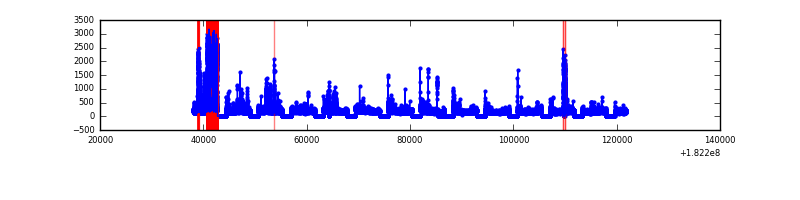 |
| C | 83684 | 61849 | 15 | 15 | 0.02% | 0.02% | 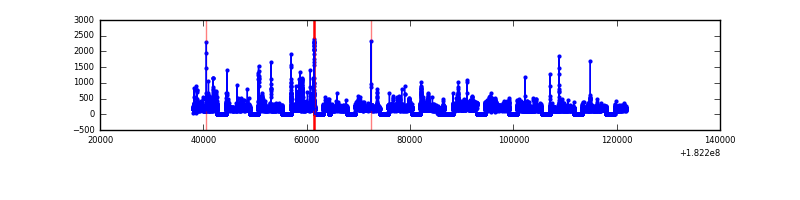 |
| D | 83684 | 61925 | 685 | 685 | 0.82% | 1.11% |  |
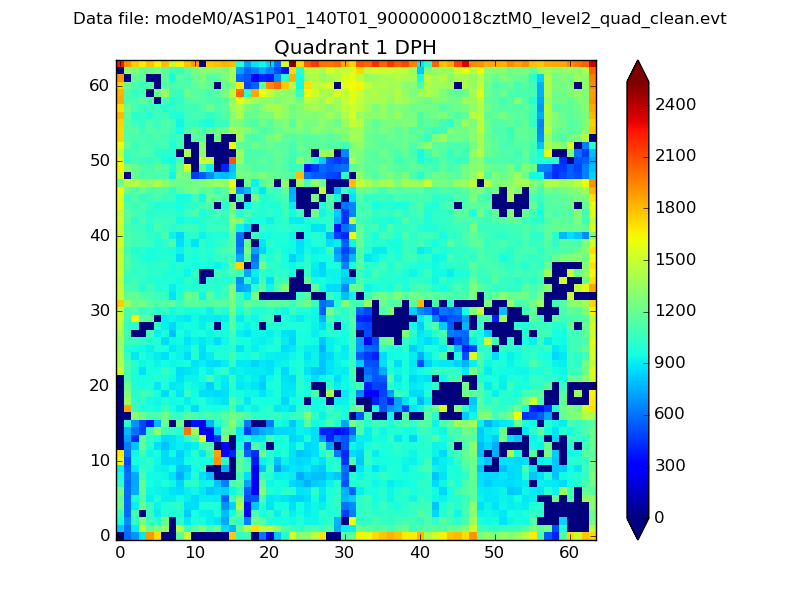
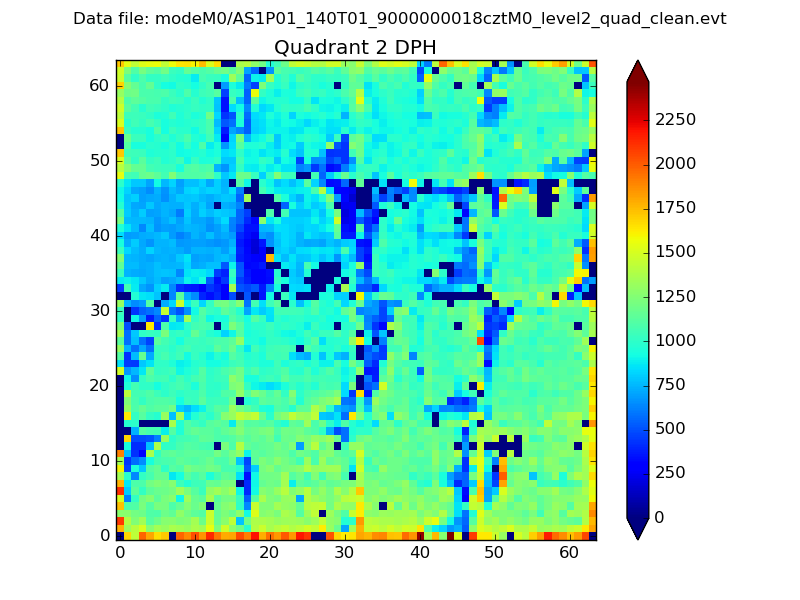
Top three noisy pixels from each quadrant. If the there are fewer than three noisy pixels in the level2.evt file, extra rows are filled as -1
| Pixel properties | Quadrant properties | ||||||
|---|---|---|---|---|---|---|---|
| Quadrant | DetID | PixID | Counts | Sigma | Mean | Median | Sigma |
| A | 15 | 66 | 2104755 | 3846.5 | 2626 | 2567 | 546.5 |
| A | 0 | 6 | 436990 | 794.89 | 2626 | 2567 | 546.5 |
| A | 13 | 145 | 425933 | 774.66 | 2626 | 2567 | 546.5 |
| B | 0 | 247 | 2513026 | 5246.8 | 2677 | 2592 | 478.5 |
| B | 8 | 5 | 486190 | 1010.72 | 2677 | 2592 | 478.5 |
| B | 0 | 183 | 142915 | 293.27 | 2677 | 2592 | 478.5 |
| C | 0 | 186 | 605345 | 1073.39 | 2624 | 2574 | 561.6 |
| C | 1 | 192 | 141140 | 246.75 | 2624 | 2574 | 561.6 |
| C | 1 | 1 | 85252 | 147.23 | 2624 | 2574 | 561.6 |
| D | 1 | 4 | 1708565 | 2858.54 | 2597 | 2521 | 596.8 |
| D | 12 | 249 | 1490726 | 2493.54 | 2597 | 2521 | 596.8 |
| D | 14 | 23 | 671433 | 1120.79 | 2597 | 2521 | 596.8 |
Histogram calculated using DETX and DETY for each event in the final _common_clean file
| Quadrant A |  |
 |
Quadrant B |
|---|---|---|---|
| Quadrant D |  |
 |
Quadrant C |
| Plot type | Count rate plots | Images |
|---|---|---|
| Comparison with Poisson distribution Blue bars denote a histogram of data divided into 1 sec bins. Red curve is a Poisson curve with rate = median count rate of data. |
 |
 |
| Quadrant-wise count rates Data is divided into 100 sec bins |
 |
|
| Module-wise count rates for Quadrant A Data is divided into 100 sec bins |
 |
 |
| Module-wise count rates for Quadrant B Data is divided into 100 sec bins |
 |
 |
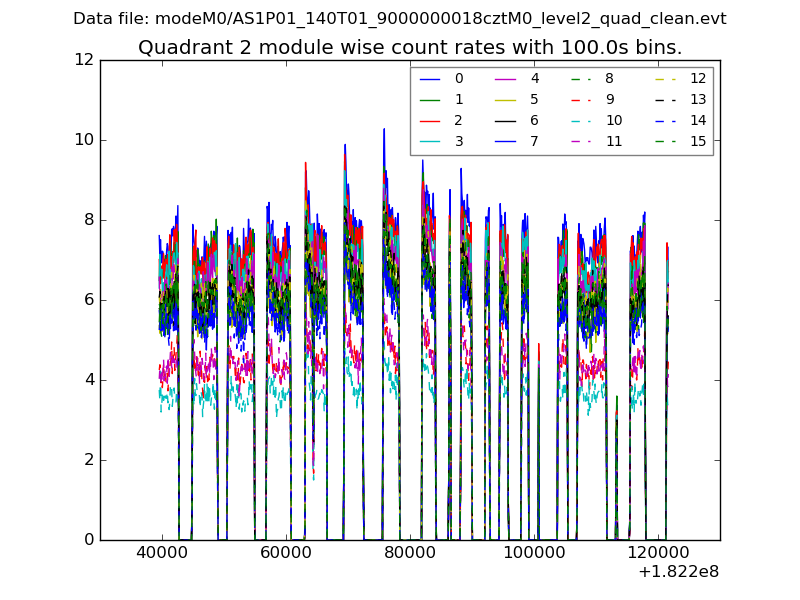
| Module-wise count rates for Quadrant C Data is divided into 100 sec bins |
 |
 |
| Module-wise count rates for Quadrant D Data is divided into 100 sec bins |
 |
 |
| Parameter | Plot |
|---|---|
| CZT HV Monitor | 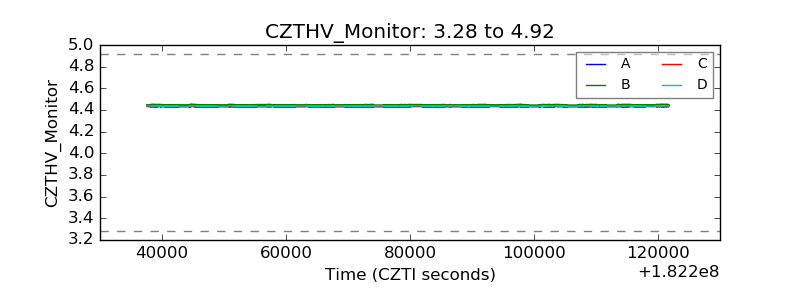 |
| D_VDD | 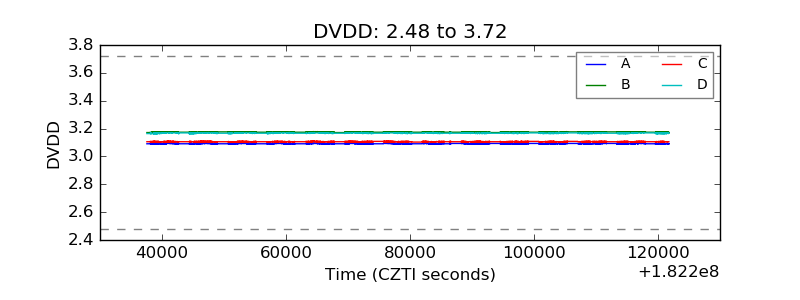 |
| Temperature 1 |  |
| Veto HV Monitor | 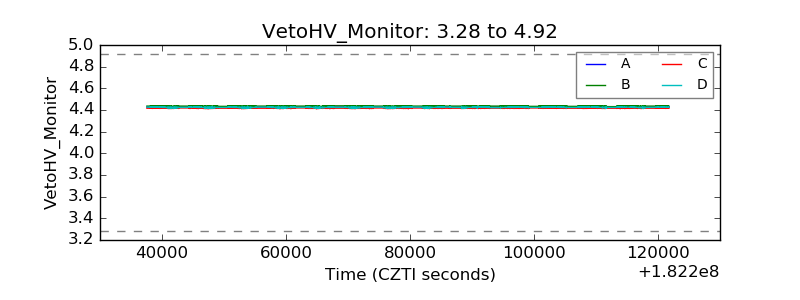 |
| Veto LLD |  |
| Alpha Counter |  |
| _CPM_Rate | 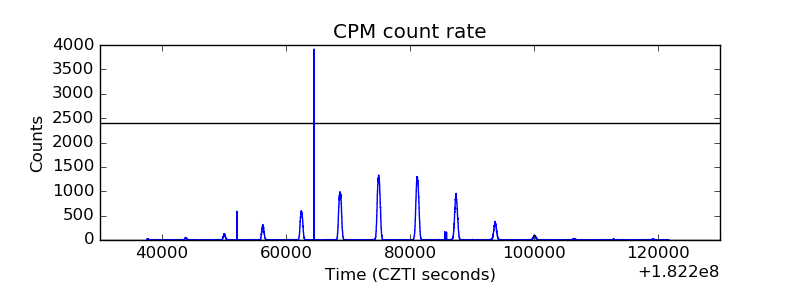 |
| CZT Counter |  |
| +2.5 Volts monitor |  |
| +5 Volts monitor |  |
| _ROLL_ROT |  |
| _Roll_DEC |  |
| _Roll_RA |  |
| Veto Counter |  |