| Param | Original file | Final file |
|---|---|---|
| Filename | modeM0/AS1P01_134T02_9000000010cztM0_level2_bc.evt | modeM0/AS1P01_134T02_9000000010cztM0_level2_quad_clean.evt |
| Size (bytes) | 731,185,920 | 163,650,240 |
| Size | 697.3 MB | 156.1 MB |
| Events in quadrant A | 3,327,246 | 1,031,187 |
| Events in quadrant B | 7,905,493 | 783,927 |
| Events in quadrant C | 3,351,755 | 1,049,162 |
| Events in quadrant D | 6,457,744 | 983,586 |
| Mode SS | |||
|---|---|---|---|
| Quadrant | BADHDUFLAG | Total packets | Discarded packets |
| A | 0 | 328 | 0 |
| B | 0 | 328 | 0 |
| C | 0 | 328 | 0 |
| D | 0 | 328 | 0 |
| Mode M0 | |||
|---|---|---|---|
| Quadrant | BADHDUFLAG | Total packets | Discarded packets |
| A | 0 | 68725 | 0 |
| B | 0 | 102873 | 0 |
| C | 0 | 65211 | 0 |
| D | 0 | 80355 | 0 |
| Mode M9 | |||
|---|---|---|---|
| Quadrant | BADHDUFLAG | Total packets | Discarded packets |
| A | 0 | 63 | 0 |
| B | 0 | 63 | 0 |
| C | 0 | 63 | 0 |
| D | 0 | 63 | 0 |
| Quadrant | Total seconds | Saturated seconds | Saturation percentage |
|---|---|---|---|
| A | 16041 | 24 | 0.149617% |
| B | 16037 | 4561 | 28.440481% |
| C | 16038 | 26 | 0.162115% |
| D | 16040 | 1436 | 8.952618% |
Noise dominated data is calculated using 1-second bins in cleaned event files. If a bin has >2000 counts, and if more than 50% of those come from <1% of pixels, then it is considered to be noise-dominated and hence unusable.
| Quadrant | # 1 sec bins | Bins with >0 counts | Bins with >2000 counts | High rate bins dominated by noise | Noise dominated (total time) | Noise dominated (detector-on time) | Marked lightcurve |
|---|---|---|---|---|---|---|---|
| A | 20871 | 16037 | 1 | 1 | 0.00% | 0.01% |  |
| B | 20875 | 16030 | 186 | 186 | 0.89% | 1.16% | 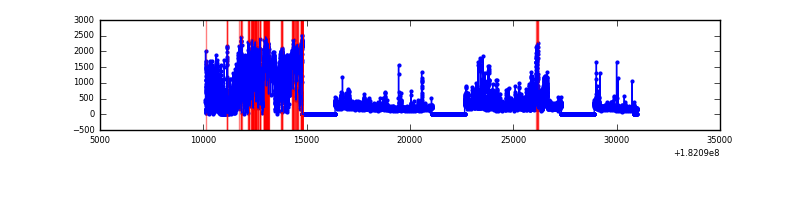 |
| C | 20873 | 16035 | 5 | 5 | 0.02% | 0.03% |  |
| D | 20870 | 16038 | 24 | 24 | 0.11% | 0.15% |  |
Top three noisy pixels from each quadrant. If the there are fewer than three noisy pixels in the level2.evt file, extra rows are filled as -1
| Pixel properties | Quadrant properties | ||||||
|---|---|---|---|---|---|---|---|
| Quadrant | DetID | PixID | Counts | Sigma | Mean | Median | Sigma |
| A | 14 | 10 | 174429 | 1128.64 | 741 | 726 | 153.9 |
| A | 14 | 171 | 75204 | 483.92 | 741 | 726 | 153.9 |
| A | 0 | 96 | 24033 | 151.44 | 741 | 726 | 153.9 |
| B | 5 | 216 | 3426399 | 32461.04 | 592 | 573 | 105.5 |
| B | 8 | 233 | 1729955 | 16386.57 | 592 | 573 | 105.5 |
| B | 10 | 199 | 271303 | 2565.27 | 592 | 573 | 105.5 |
| C | 0 | 202 | 126529 | 810.57 | 746 | 735 | 155.2 |
| C | 12 | 48 | 78050 | 498.19 | 746 | 735 | 155.2 |
| C | 8 | 31 | 34123 | 215.14 | 746 | 735 | 155.2 |
| D | 2 | 121 | 1287779 | 8094.17 | 702 | 682 | 159.0 |
| D | 13 | 89 | 917020 | 5762.57 | 702 | 682 | 159.0 |
| D | 12 | 14 | 345298 | 2167.19 | 702 | 682 | 159.0 |
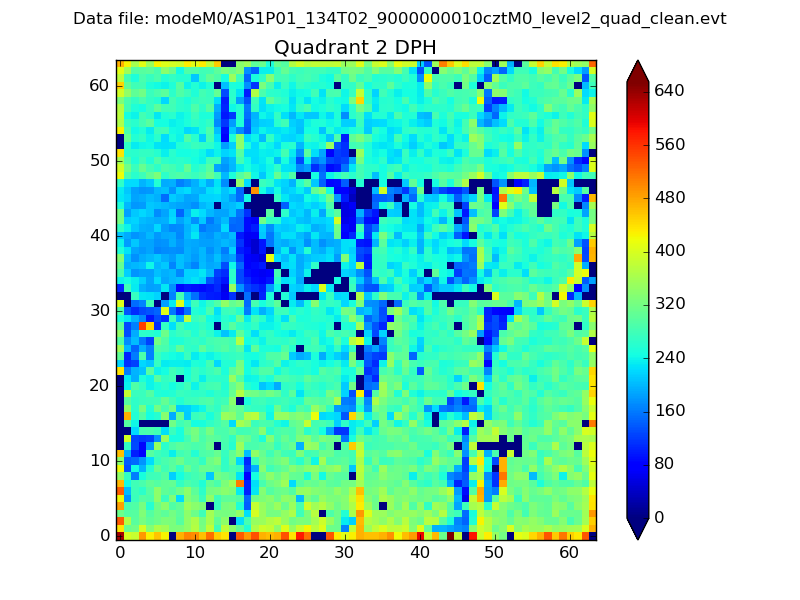
Histogram calculated using DETX and DETY for each event in the final _common_clean file
| Quadrant A |  |
 |
Quadrant B |
|---|---|---|---|
| Quadrant D |  |
 |
Quadrant C |
| Plot type | Count rate plots | Images |
|---|---|---|
| Comparison with Poisson distribution Blue bars denote a histogram of data divided into 1 sec bins. Red curve is a Poisson curve with rate = median count rate of data. |
 |
 |
| Quadrant-wise count rates Data is divided into 100 sec bins |
 |
|
| Module-wise count rates for Quadrant A Data is divided into 100 sec bins |
 |
 |
| Module-wise count rates for Quadrant B Data is divided into 100 sec bins |
 |
 |
| Module-wise count rates for Quadrant C Data is divided into 100 sec bins |
 |
 |
| Module-wise count rates for Quadrant D Data is divided into 100 sec bins |
 |
 |
| Parameter | Plot |
|---|---|
| CZT HV Monitor |  |
| D_VDD |  |
| Temperature 1 |  |
| Veto HV Monitor |  |
| Veto LLD |  |
| Alpha Counter |  |
| _CPM_Rate |  |
| CZT Counter | 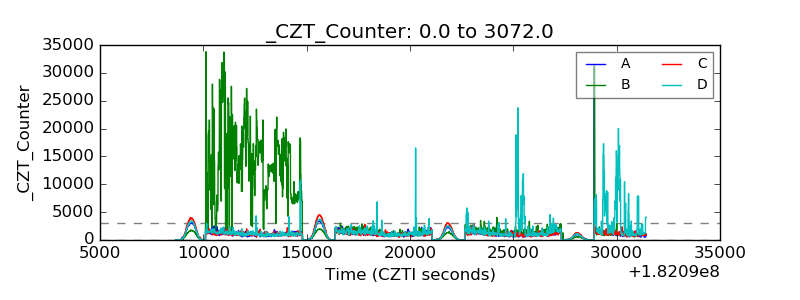 |
| +2.5 Volts monitor |  |
| +5 Volts monitor |  |
| _ROLL_ROT | 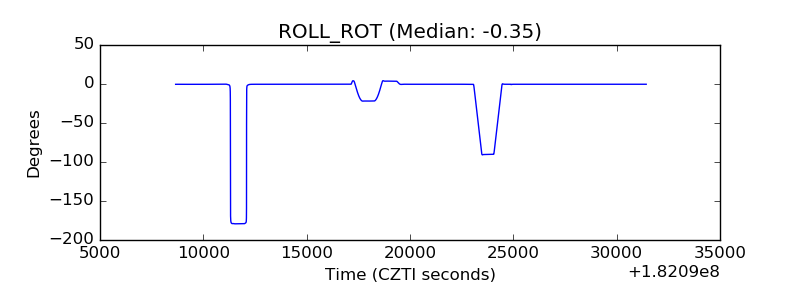 |
| _Roll_DEC |  |
| _Roll_RA |  |
| Veto Counter |  |