| Param | Original file | Final file |
|---|---|---|
| Filename | modeM0/AS1P01_003T01_9000000002cztM0_level2.fits | modeM0/AS1P01_003T01_9000000002cztM0_level2_quad_clean.evt |
| Size (bytes) | 7,692,635,520 | 612,889,920 |
| Size | 7.2 GB | 584.5 MB |
| Events in quadrant A | 70,345,640 | 3,717,640 |
| Events in quadrant B | 70,205,781 | 3,789,719 |
| Events in quadrant C | 66,479,093 | 3,717,057 |
| Events in quadrant D | 73,607,139 | 3,604,539 |
| Mode SS | |||
|---|---|---|---|
| Quadrant | BADHDUFLAG | Total packets | Discarded packets |
| A | 0 | 1120 | 0 |
| B | 0 | 1122 | 0 |
| C | 0 | 1118 | 0 |
| D | 0 | 1116 | 0 |
| Mode M9 | |||
|---|---|---|---|
| Quadrant | BADHDUFLAG | Total packets | Discarded packets |
| A | 0 | 188 | 0 |
| B | 0 | 188 | 0 |
| C | 0 | 188 | 0 |
| D | 0 | 188 | 0 |
| Mode M0 | |||
|---|---|---|---|
| Quadrant | BADHDUFLAG | Total packets | Discarded packets |
| A | 0 | 247876 | 0 |
| B | 0 | 247476 | 0 |
| C | 0 | 236426 | 0 |
| D | 0 | 257740 | 0 |
| Quadrant | Total seconds | Saturated seconds | Saturation percentage |
|---|---|---|---|
| A | 54651 | 705 | 1.290004% |
| B | 54449 | 300 | 0.550974% |
| C | 54651 | 593 | 1.085067% |
| D | 53980 | 1204 | 2.230456% |
Noise dominated data is calculated using 1-second bins in cleaned event files. If a bin has >2000 counts, and if more than 50% of those come from <1% of pixels, then it is considered to be noise-dominated and hence unusable.
| Quadrant | # 1 sec bins | Bins with >0 counts | Bins with >2000 counts | High rate bins dominated by noise | Noise dominated (total time) | Noise dominated (detector-on time) | Marked lightcurve |
|---|---|---|---|---|---|---|---|
| A | 84498 | 54764 | 3233 | 3233 | 3.83% | 5.90% | 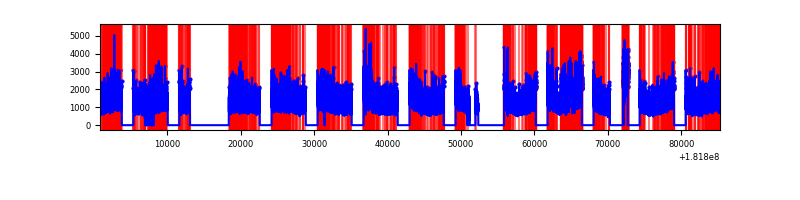 |
| B | 84498 | 54586 | 2394 | 2394 | 2.83% | 4.39% |  |
| C | 84498 | 54772 | 2838 | 2838 | 3.36% | 5.18% |  |
| D | 84498 | 54122 | 5164 | 5164 | 6.11% | 9.54% |  |
Top three noisy pixels from each quadrant. If the there are fewer than three noisy pixels in the level2.evt file, extra rows are filled as -1
| Pixel properties | Quadrant properties | ||||||
|---|---|---|---|---|---|---|---|
| Quadrant | DetID | PixID | Counts | Sigma | Mean | Median | Sigma |
| A | 15 | 127 | 3037527 | 1097.88 | 16972 | 16599 | 2751.6 |
| A | 13 | 174 | 183818 | 60.77 | 16972 | 16599 | 2751.6 |
| A | 13 | 65 | 174291 | 57.31 | 16972 | 16599 | 2751.6 |
| B | 0 | 235 | 1913498 | 535.03 | 16907 | 16870 | 3544.9 |
| B | 8 | 5 | 742859 | 204.8 | 16907 | 16870 | 3544.9 |
| B | 8 | 236 | 532362 | 145.42 | 16907 | 16870 | 3544.9 |
| C | 8 | 224 | 3024654 | 692.41 | 15401 | 15941 | 4345.3 |
| C | 9 | 204 | 1758432 | 401.01 | 15401 | 15941 | 4345.3 |
| C | 0 | 203 | 338672 | 74.27 | 15401 | 15941 | 4345.3 |
| D | 10 | 244 | 2448650 | 587.47 | 15965 | 16053 | 4140.8 |
| D | 12 | 207 | 1762157 | 421.69 | 15965 | 16053 | 4140.8 |
| D | 13 | 207 | 818904 | 193.89 | 15965 | 16053 | 4140.8 |
Histogram calculated using DETX and DETY for each event in the final _common_clean file
| Quadrant A | 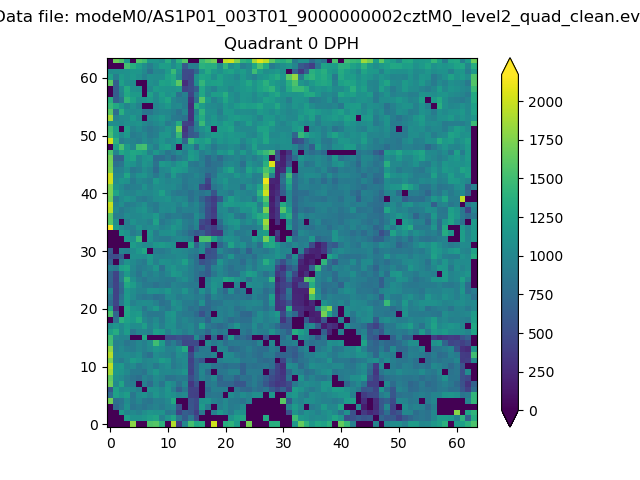 |
 |
Quadrant B |
|---|---|---|---|
| Quadrant D |  |
 |
Quadrant C |
| Plot type | Count rate plots | Images |
|---|---|---|
| Comparison with Poisson distribution Blue bars denote a histogram of data divided into 1 sec bins. Red curve is a Poisson curve with rate = median count rate of data. |
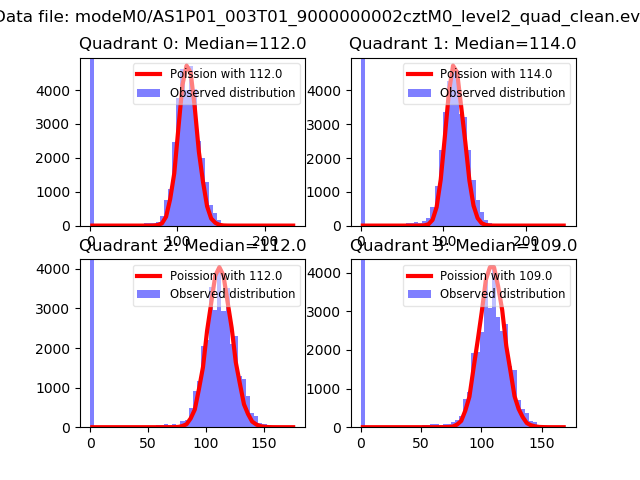 |
 |
| Quadrant-wise count rates Data is divided into 100 sec bins |
 |
|
| Module-wise count rates for Quadrant A Data is divided into 100 sec bins |
 |
 |
| Module-wise count rates for Quadrant B Data is divided into 100 sec bins |
 |
 |
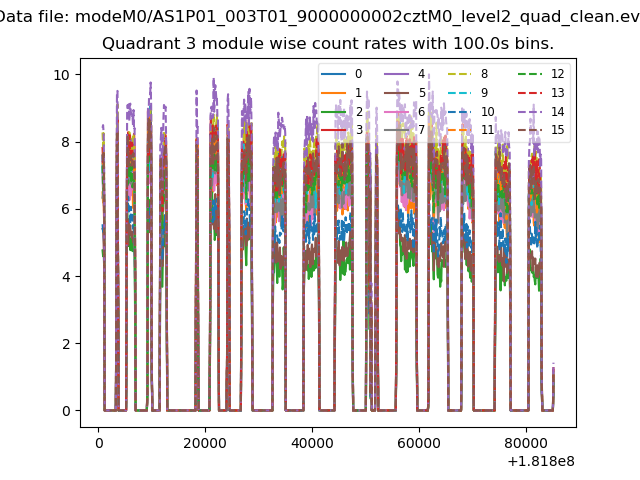
| Module-wise count rates for Quadrant C Data is divided into 100 sec bins |
 |
 |
| Module-wise count rates for Quadrant D Data is divided into 100 sec bins |
 |
 |
| Parameter | Plot |
|---|---|
| CZT HV Monitor |  |
| D_VDD |  |
| Temperature 1 |  |
| Veto HV Monitor |  |
| Veto LLD |  |
| Alpha Counter |  |
| _CPM_Rate |  |
| CZT Counter |  |
| +2.5 Volts monitor |  |
| +5 Volts monitor |  |
| _ROLL_ROT |  |
| _Roll_DEC |  |
| _Roll_RA | 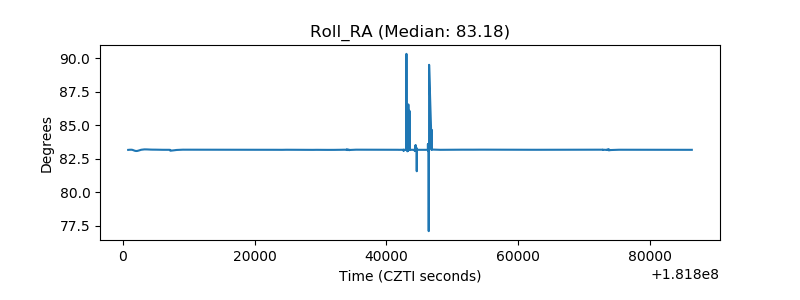 |
| Veto Counter |  |