ASTROSAT OBSERVES POLARIZATIOn OF the CRAB PULSAR


ASTROSAT OBSERVES POLARIZATIOn OF the CRAB PULSAR

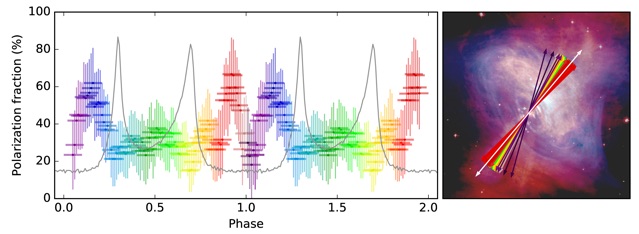
Left panel: The grey line in the graph shows the brightness of the Crab pulsar as observed by AstroSat CZTI. The horizontal axis (phase) represents time expressed in units of the pulsar’s spin period. One full rotation cycle of the pulsar happens between Phase 0.0 to 1.0. The same result is shown repeated between phase 1.0 and 2.0, for a clear demonstration of the periodic pattern. Coloured bars indicate how strongly polarised the observed radiation is. Sharp variation of polarisation when the brightness is low (red & blue) is the surprising discovery by AstroSat.
Right panel: The angle of X-ray polarisation measured by AstroSat CZTI shown superposed on a composite optical and X-ray image of the Crab nebula, taken by NASA’s Hubble and Chandra telescopes respectively. The white arrow represents the projected spin axis of the pulsar located at the centre of the nebula. Other arrows display the orientation of the observed polarisation. The colour of an arrow indicates the range of phase it belongs to, being equal to that spanned by bars of the corresponding shade in the left panel.